
The emergence of power-efficient high-performance processors has created a bright spot in the desktop PC market. The ultra-compact form factor (UCFF) heralded by the Intel NUCs has experienced rapid growth over the past few years. GIGABYTE, with their BRIX lineup, was one of the first vendors to introduce NUC clones. They went beyond the traditional Intel models and provided plenty of choices to the end users. GIGABYTE has also kept up with Intel’s release cadence and updated the BRIX lineup after the launch of new U-series CPUs. Today, we are taking a look at the GB-BKi7HA-7500 – a BRIX based on the Kaby Lake Core i7-7500U, with support for a 2.5″ drive, and sporting an ASMedia bridge chip for USB 3.1 Gen 2 support.
The Kaby Lake-U platform for mini-PCs has proved to be a simple one for OEMs with existing Skylake-U mini-PCs in their lineup. Given the pin compatibility, the vendors only needed to put in some BIOS support before swapping the Skylake-U package for a Kaby Lake-U one. We have already covered the advantages of Kaby Lake over Skylake for mini-PCs (such as 4K Netflix and improved perf/Watt) in earlier reviews.
A look at the GIGABYTE BRIX listings shows more than 20 different Skylake-U units (models starting with GB-BS). Given that Kaby Lake doesn’t provide a great deal of benefit over Skylake for many use-cases, GIGABYTE has decided to only selectively update the comprehensive lineup. Each barebones Skylake BRIX SKU has a model number fitting the following format:
GB-BS<CoreSeriesIdentifier-01>(H)(T|A)(L|C)-<CoreSeriesIdentifier-02>
The format changes for Kaby Lake, with the BS being replaced by BK. The CPU in the SKU can be determined using the CoreSeriesIdentifier. For example, our review sample, the GB-BK<i7>HA-<7500> has the Intel Core i7-7500U. The other parts of the model number are optional. For example, in the Skylake series, we have the GB-BSi7-6500, which is essentially a Skylake-U NUC clone with no bells and whistles, but, just sporting a CPU option that the Intel NUC lineup doesn’t provide.
The optional components indicate the presence of the following features:
- H = 2.5″ drive support
- T = Thunderbolt 3 / USB 3.1 Gen 2 using the Alpine Ridge chipset
- A = Dual USB 3.1 Gen 2 ports (1x Type-A and 1x Type-C) using the ASMedia 1142 USB 3.1 Gen 2 controller
- L = Dual RJ-45 gigabit LAN ports
- C = COM (RS-232) port (RJ-45 slot similar to the L SKU, and a RJ-45 to COM cable bundled)
As part of the Kaby Lake update, GIGABYTE has introduced ten models, with a choice of Core i3, Core i5, or Core i7, with or without support for a 2.5″ drive, and a Thunderbolt (no ASMedia USB 3.1 Gen 2) or non-Thunderbolt (but, with ASMedia USB 3.1 Gen 2) option.
GIGABYTE sampled us the barebones version of the GB-BKi7HA-7500. We completed the configuration using a Samsung SSD 950 PRO 512GB M.2 PCIe 3.0 x4 NVMe SSD and 2×16 GB Crucial Ballistix Sport LT DDR SODIMMs. Though the SODIMMs are capable of operating at 2400 MHz, the BRIX set it to operate at 2133 MHz. The specifications of our review configuration are summarized below.
| GIGABYTE GB-BKi7HA-7500 Specifications | |
| Processor | Intel Core i7-7500U Kaby Lake, 2C/4T, 2.7 GHz (Turbo to 3.5 GHz), 14nm PLUS, 4MB L2, 15W TDP |
| Memory | Crucial Ballistix Sport LT BLS16G4S240FSD.16FAD DDR4 15-15-15-35 @ 2133 MHz 2×16 GB |
| Graphics | Intel HD Graphics 620 |
| Disk Drive(s) | Samsung SSD 950 PRO (512 GB; M.2 Type 2280 PCIe 3.0 x4 NVMe; 40nm; MLC V-NAND) |
| Networking | Intel Dual Band Wireless-AC 3168 (1×1 802.11ac – 433 Mbps) Intel Gigabit Ethernet Connection I219-LM |
| Audio | 3.5mm Headphone Jack Capable of 5.1/7.1 digital output with HD audio bitstreaming (HDMI) |
| Display | 1x HDMI 2.0 (HDCP 2.2 / 4Kp60-capable) 1x mini-DisplayPort 1.2 |
| Miscellaneous I/O Ports | 1x USB 3.1 Gen 2 Type-C 1x USB 3.1 Gen 2 Type-A 2x USB 3.0 |
| Operating System | Retail unit is barebones, but we installed Windows 10 Pro x64 |
| Pricing (As configured) | $ 500 ($ 1074) |
| Full Specifications | GIGABYTE GB-BKi7HA-7500 Specifications |
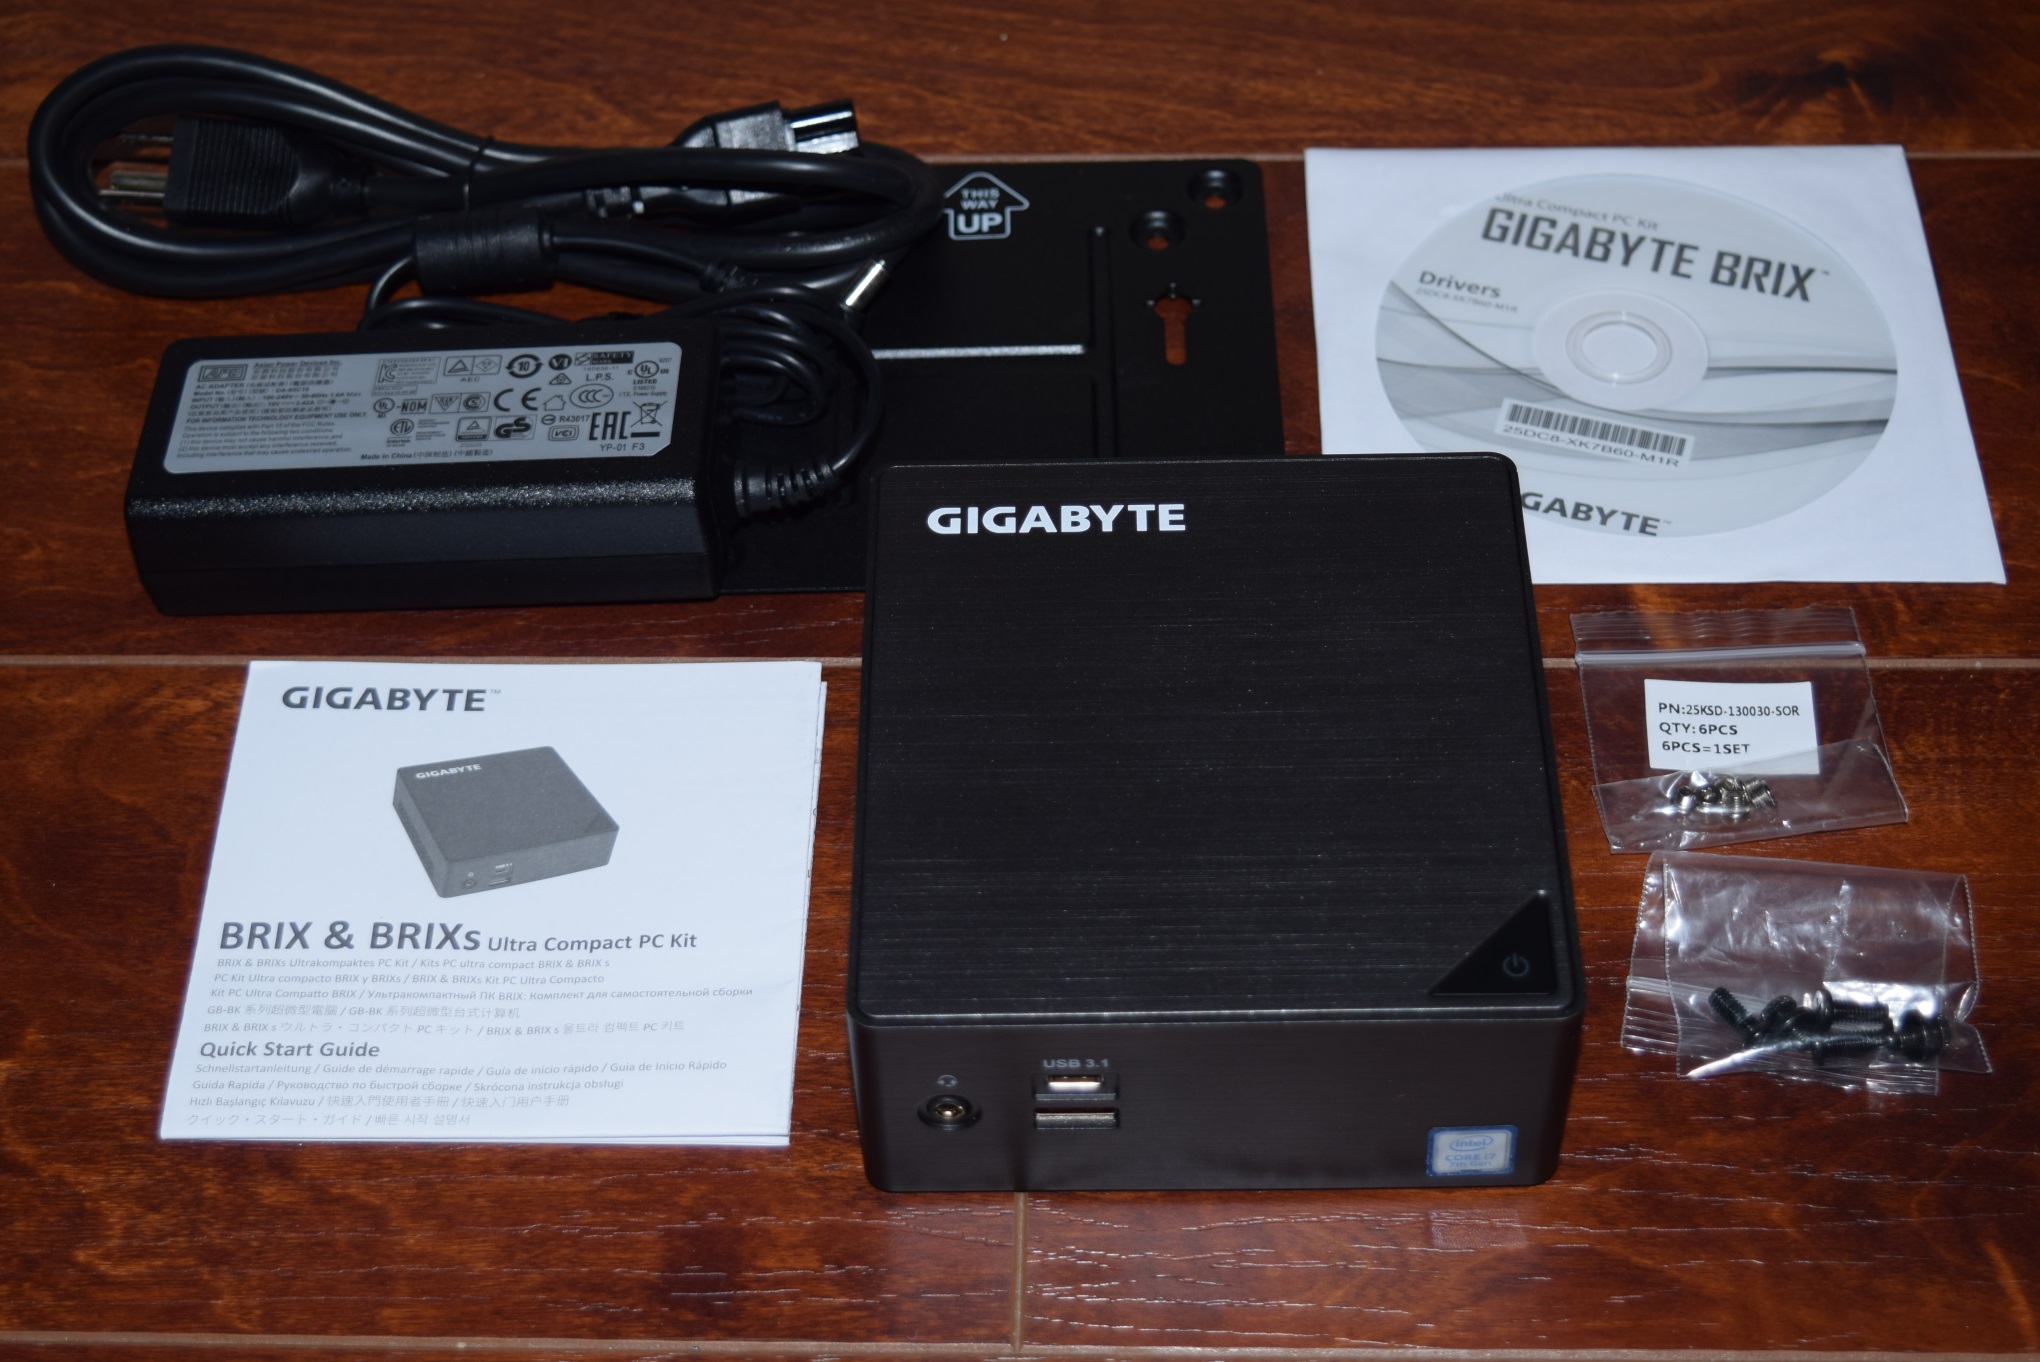
The GB-BKi7HA-7500 come with a CD and a read-only USB key containing Windows drivers. In any case, we ended up installing the latest drivers downloaded off GIGABYTE’s product support page. In addition to the main unit, the other components of the package include a 65 W (19V @ 3.42A) adapter with a US power connector, a VESA mount (along with the necessary screws), a driver CD and USB key, and a quick-start guide.
The unit also supports a 2.5″ drive. The appropriate SATA cable (data and power together in the typical notebook form factor) is pre-installed inside the main unit (as can be seen in the gallery below).


The metal frame on the inside of the bottom lid (which holds the 2.5″ drive in place) also has a thermal pad positioned to aid in the dissipation of heat from any M.2 SSD used in the system.
The high-speed I/O lane distribution in the GB-BKi7HA-7500 is similar to what we saw in the Skylake BRIX. The PCIe lanes are distributed as below:
- PCI-E 3.0 x2 port #1 In Use @ x2 (ASMedia ASM1142 USB 3.1 xHCI Controller)
- PCI-E 3.0 x1 port #6 In Use @ x1 (Intel Dual Band Wireless-AC 3168 AC HMC WiFi Adapter)
- PCI-E 3.0 x4 port #9 In Use @ x4 (Samsung SSD 950 PRO NVMe Drive)
In the table below, we have an overview of the various systems that we are comparing the GIGABYTE GB-BKi7HA-7500 against. Note that they may not belong to the same market segment. The relevant configuration details of the machines are provided so that readers have an understanding of why some benchmark numbers are skewed for or against the GIGABYTE GB-BKi7HA-7500 when we come to those sections.
| Comparative PC Configurations | ||
| Aspect | GIGABYTE GB-BKi7HA-7500 | |
| CPU | Intel Core i7-7500U | Intel Core i7-7500U |
| GPU | Intel HD Graphics 620 | Intel HD Graphics 620 |
| RAM | Crucial Ballistix Sport LT BLS16G4S240FSD.16FAD DDR4 15-15-15-35 @ 2133 MHz 2×16 GB |
Crucial Ballistix Sport LT BLS16G4S240FSD.16FAD DDR4 15-15-15-35 @ 2133 MHz 2×16 GB |
| Storage | Samsung SSD 950 PRO (512 GB; M.2 Type 2280 PCIe 3.0 x4 NVMe; 40nm; MLC V-NAND) |
Samsung SSD 950 PRO (512 GB; M.2 Type 2280 PCIe 3.0 x4 NVMe; 40nm; MLC V-NAND) |
| Wi-Fi | Intel Dual Band Wireless-AC 3168 (1×1 802.11ac – 433 Mbps) |
Intel Dual Band Wireless-AC 3168 (1×1 802.11ac – 433 Mbps) |
| Price (in USD, when built) | $ 500 (barebones) $ 1074 (as configured) |
$ 500 (barebones) $ 1074 (as configured) |
The GIGABYTE GB-BKi7HA-7500 was evaluated using our standard test suite for low power desktops / industrial PCs. Not all benchmarks were processed on all the machines due to updates in our testing procedures. Therefore, the list of PCs in each graph might not be the same. In the first section, we will be looking at SYSmark 2014 SE, as well as some of the Futuremark benchmarks.
BAPCo SYSmark 2014 SE
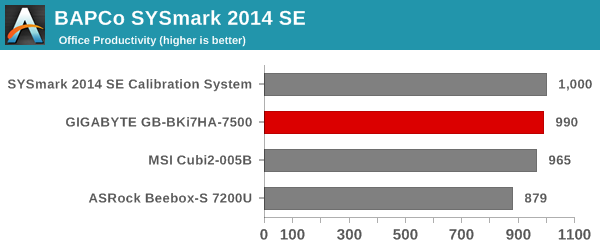
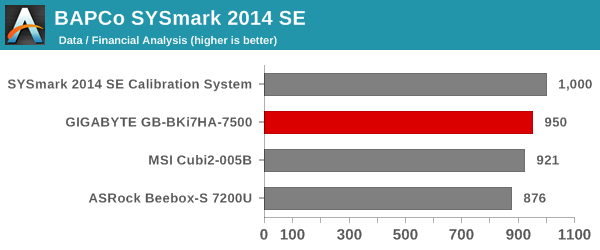
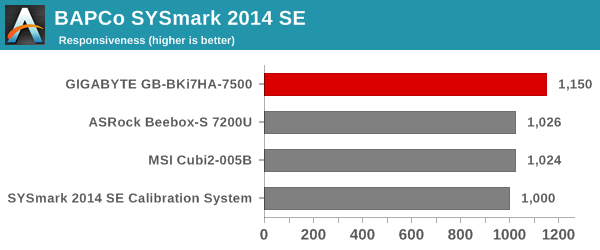
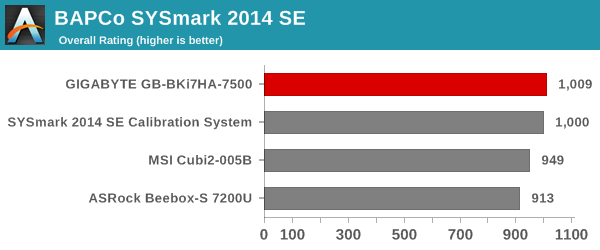
BAPCo’s SYSmark 2014 SE is an application-based benchmark that uses real-world applications to replay usage patterns of business users in the areas of office productivity, media creation and data/financial analysis. In addition, it also addresses the responsiveness aspect which deals with user experience as related to application and file launches, multi-tasking etc. Scores are meant to be compared against a reference desktop (the SYSmark 2014 SE calibration system in the graphs below). While the SYSmark 2014 benchmark used a Haswell-based desktop configuration, the SYSmark 2014 SE makes the move to a Lenovo ThinkCenter M800 (Intel Core i3-6100, 4GB RAM and a 256GB SATA SSD). The calibration system scores 1000 in each of the scenarios. A score of, say, 2000, would imply that the system under test is twice as fast as the reference system.
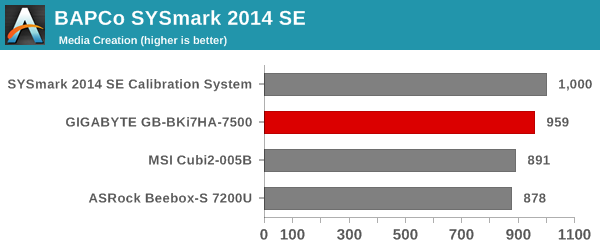
The graphs below show that the 65W desktop CPU in the calibration system manages to outperform the 15W Core i7-7500U for all the performance-sensitive workloads. However, in the responsiveness workload, the NVMe SSD in the BRIX helps it to surpass the calibration system (equipped with a SATA SSD). The same NVMe SSD was also used in the ASRock Beebox-S 7200U. However, the Core i7 vs. Core i5 match-up makes the BRIX better on a comparative basis.
SYSmark 2014 SE also adds energy measurement to the mix. A high score in the SYSmark benchmarks might be nice to have, but, potential customers also need to determine the balance between power consumption and the efficiency of the system. For example, in the average office scenario, it might not be worth purchasing a noisy and power-hungry PC just because it ends up with a 2000 score in the SYSmark 2014 SE benchmarks. In order to provide a balanced perspective, SYSmark 2014 SE also allows vendors and decision makers to track the energy consumption during each workload. In the graphs below, we find the total energy consumed by the PC under test for a single iteration of each SYSmark 2014 SE workload and how it compares against the calibration systems.
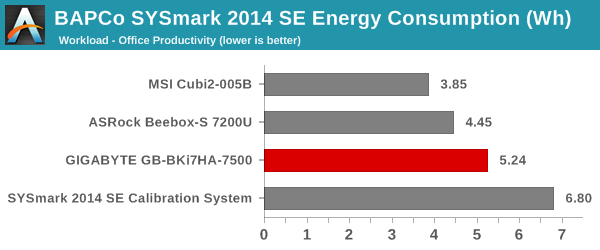
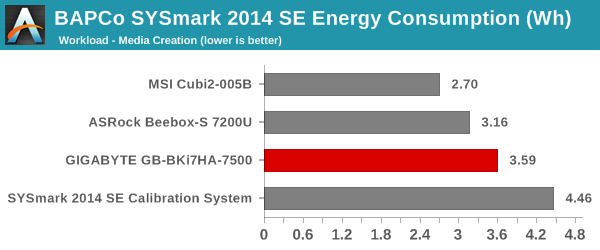
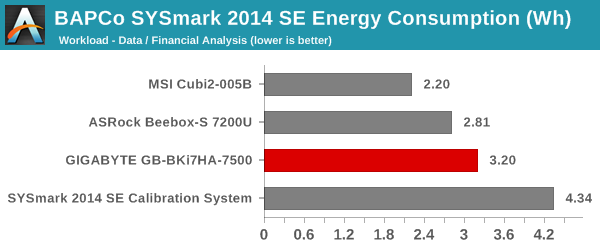
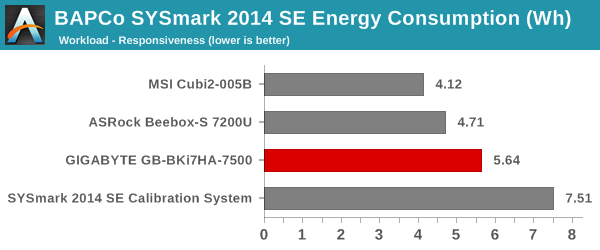
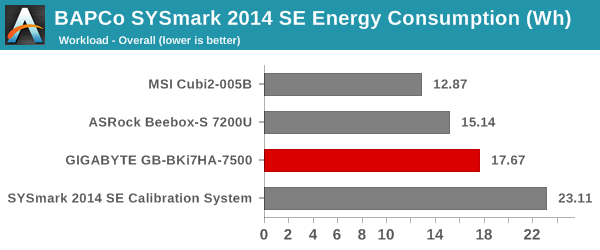
It is logical that delivering higher performance / scores usually ends up consuming more energy, and that is evident from the graphs above.
Futuremark PCMark 8
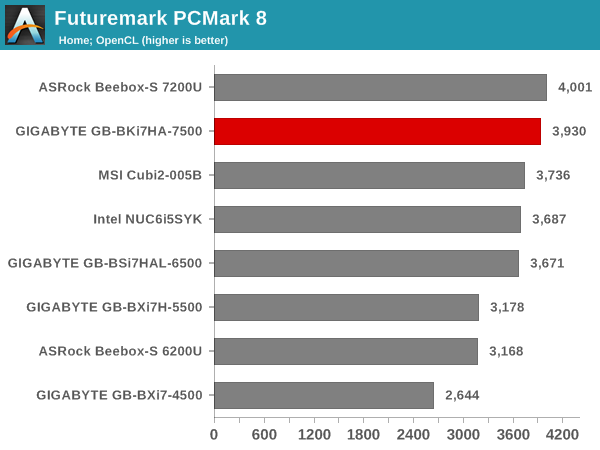
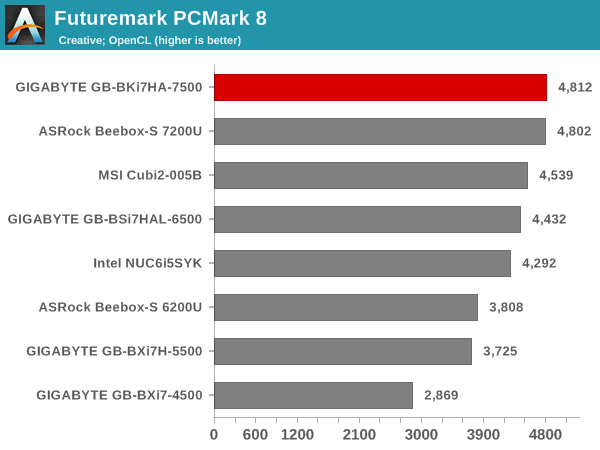
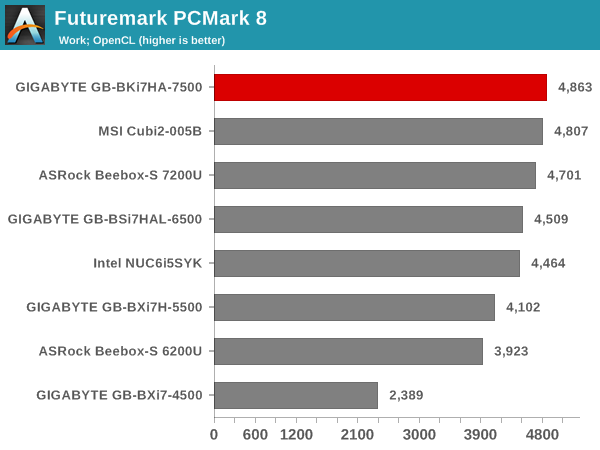
PCMark 8 provides various usage scenarios (home, creative and work) and offers ways to benchmark both baseline (CPU-only) as well as OpenCL accelerated (CPU + GPU) performance. We benchmarked select PCs for the OpenCL accelerated performance in all three usage scenarios. These scores are heavily influenced by the CPU in the system. The BRIX comes out on top in most of the workloads, but the ASRock Beebox-S 7200U performs in a similar manner.
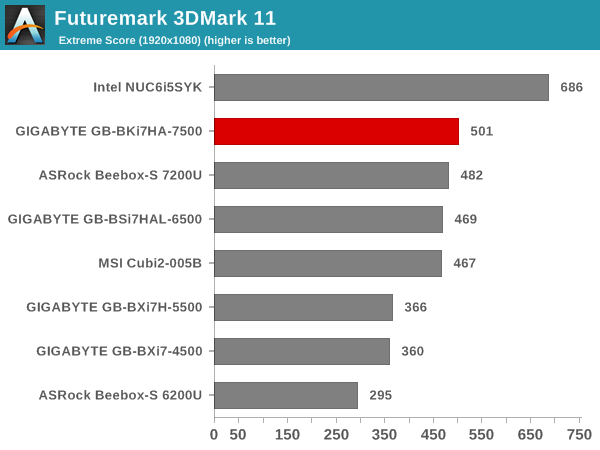
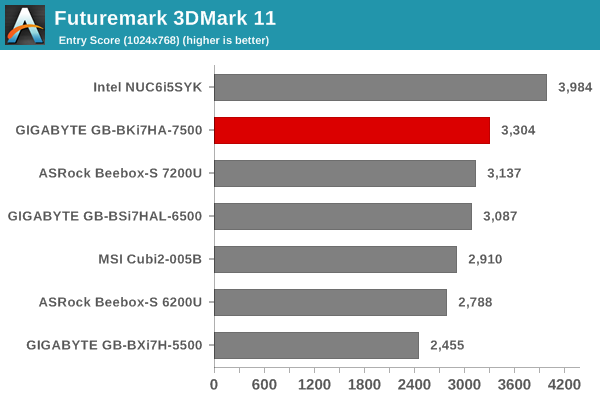
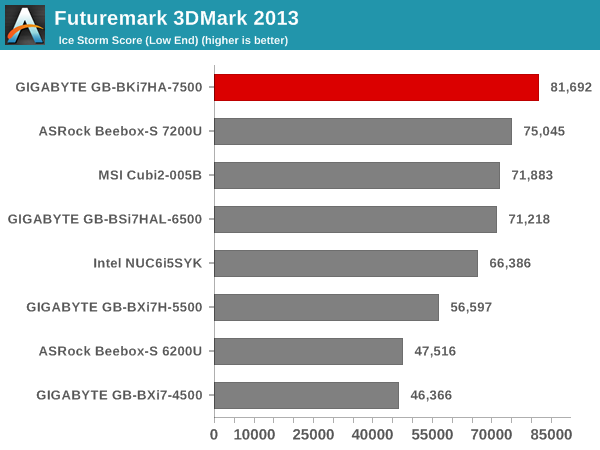
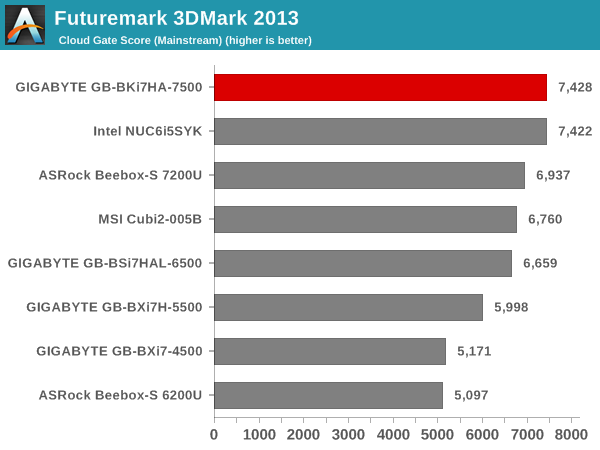
Miscellaneous Futuremark Benchmarks
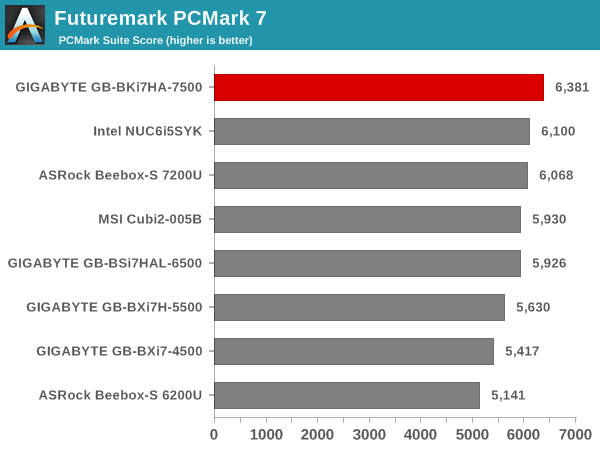
The BRIX comes with the Intel HD Graphics 620, and the configuration is the same as the other Kaby Lake UCFF PCs we have evaluated. However, the GPU workloads work in favour of the BRIX (since some aspects are CPU-limited). That said, the Iris Pro graphics engine in the Intel NUC6i5SYK performs better than the BRIX’s GPU.
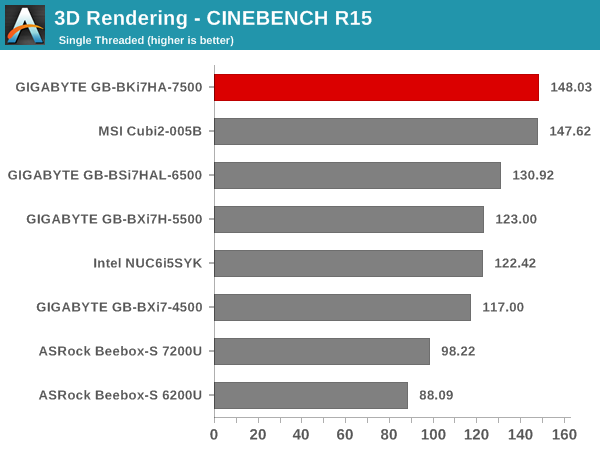
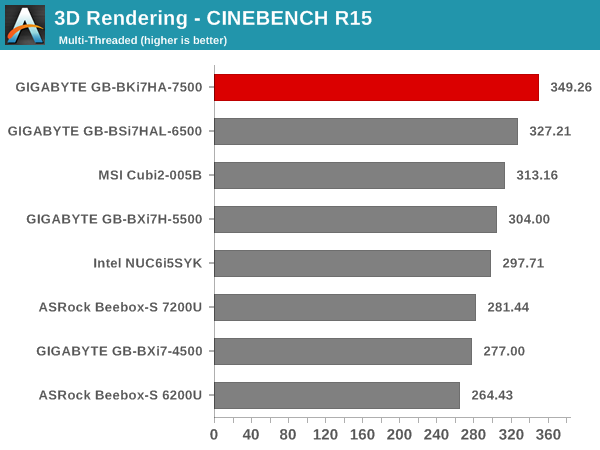
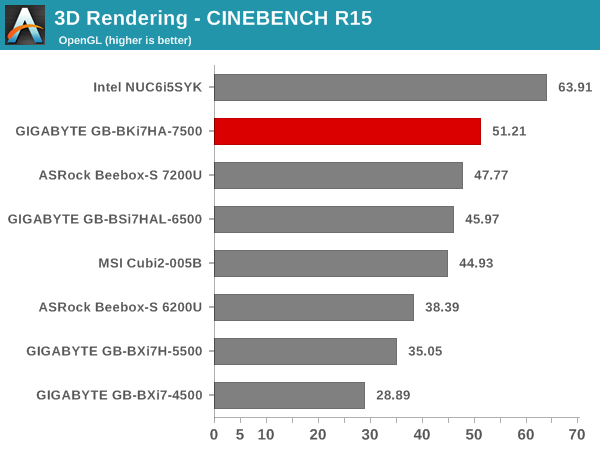
3D Rendering – CINEBENCH R15
We have moved on from R11.5 to R15 for 3D rendering evaluation. CINEBENCH R15 provides three benchmark modes – OpenGL, single threaded and multi-threaded. Evaluation of select PCs in all three modes provided us the following results. As expected, the CPU-bound benchmarks favor the BRIX. The Iris Pro-equipped NUC6i5SYK comes out on top in the OpenGL version.
In this section, we mainly look at benchmark modes in programs used on a day-to-day basis, i.e, application performance and not synthetic workloads.
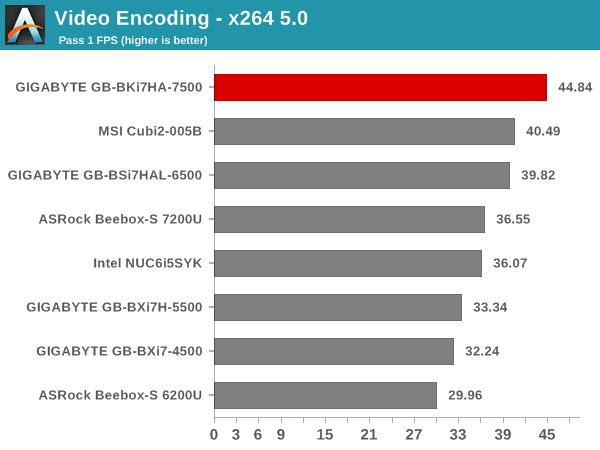
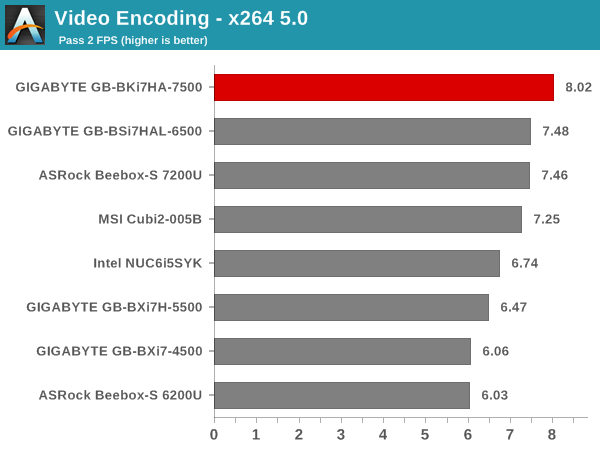
x264 Benchmark
First off, we have some video encoding benchmarks courtesy of x264 HD Benchmark v5.0. This is simply a test of CPU performance. As expected, the Core i7-7500U helps the BRIX come out on top in both passes.
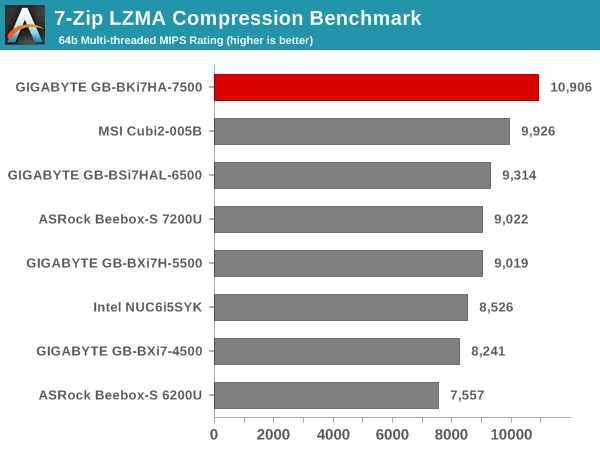
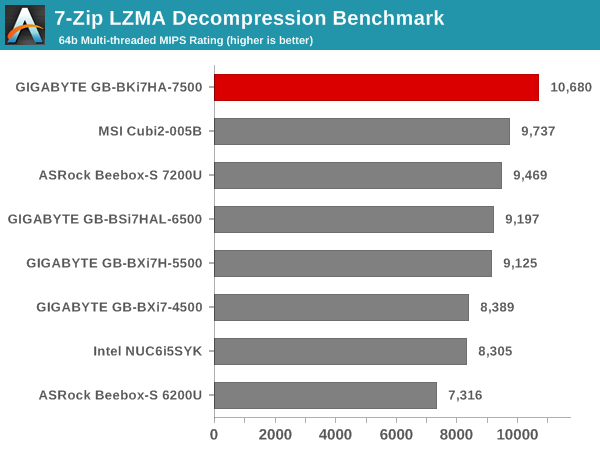
7-Zip
7-Zip is a very effective and efficient compression program, often beating out OpenCL accelerated commercial programs in benchmarks even while using just the CPU power. 7-Zip has a benchmarking program that provides tons of details regarding the underlying CPU’s efficiency. In this subsection, we are interested in the compression and decompression MIPS ratings when utilizing all the available threads.
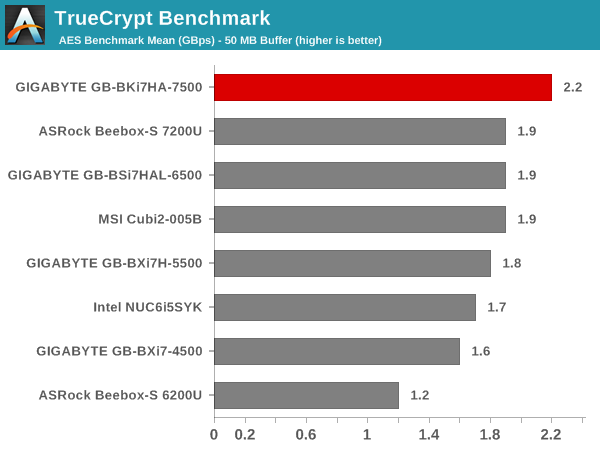
TrueCrypt
As businesses (and even home consumers) become more security conscious, the importance of encryption can’t be overstated. CPUs supporting the AES-NI instruction can accelerate the encryption and decryption processes. The Core i7-7500U has AES-NI support. TrueCrypt, a popular open-source disk encryption program can take advantage of this. The TrueCrypt internal benchmark provides some interesting cryptography-related numbers to ponder. In the graph below, we can get an idea of how fast a TrueCrypt volume would behave in the GIGABYTE GB-BKi7HA-7500 and how it would compare with other select PCs. This is a purely CPU feature / clock speed based test. Note that the BRIX can operate at a higher power level for a longer duration compared to other Kaby Lake UCFF PCs. That explains why the Cubi2-005B comes behind the GB-BKi7HA-7500 in this test despite sporting the same processor.
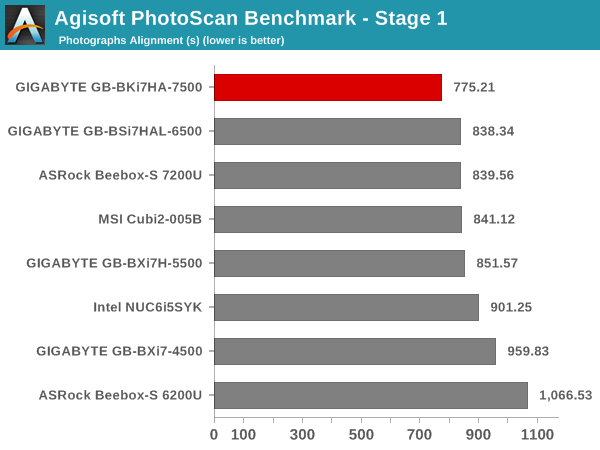
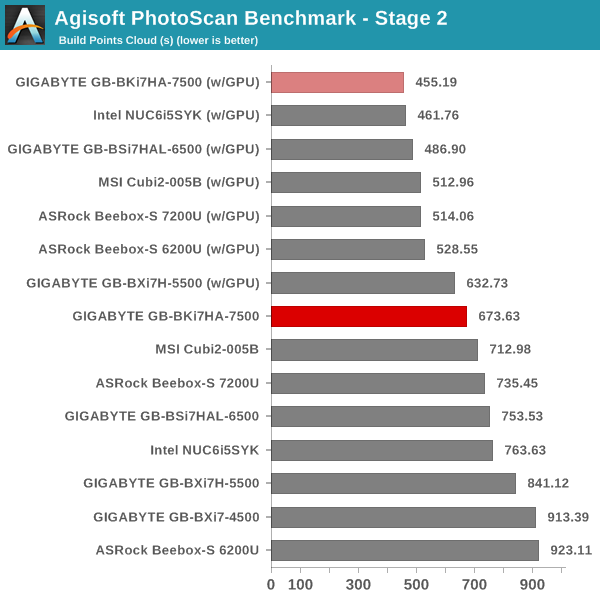
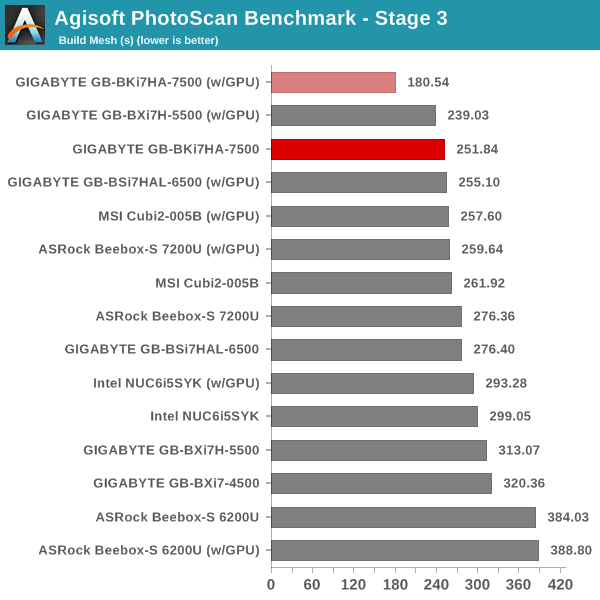
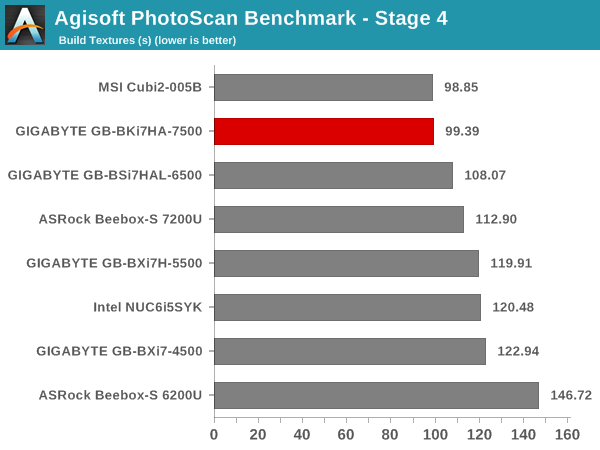
Agisoft Photoscan
Agisoft PhotoScan is a commercial program that converts 2D images into 3D point maps, meshes and textures. The program designers sent us a command line version in order to evaluate the efficiency of various systems that go under our review scanner. The command line version has two benchmark modes, one using the CPU and the other using both the CPU and GPU (via OpenCL). The benchmark takes around 50 photographs and does four stages of computation:
- Stage 1: Align Photographs
- Stage 2: Build Point Cloud (capable of OpenCL acceleration)
- Stage 3: Build Mesh
- Stage 4: Build Textures
We record the time taken for each stage. Since various elements of the software are single threaded, others multithreaded, and some use GPUs, it is interesting to record the effects of CPU generations, speeds, number of cores, DRAM parameters and the GPU using this software.
Workloads that stress the CPU for long durations like Photoscan lower the effectiveness of the BRIX configuration. While the initial higher power budget helps the BRIX come out on top in the first three stages, we find that the MSI Cubi2-005B catches up in Stage 4 and starts delivering similar performance.
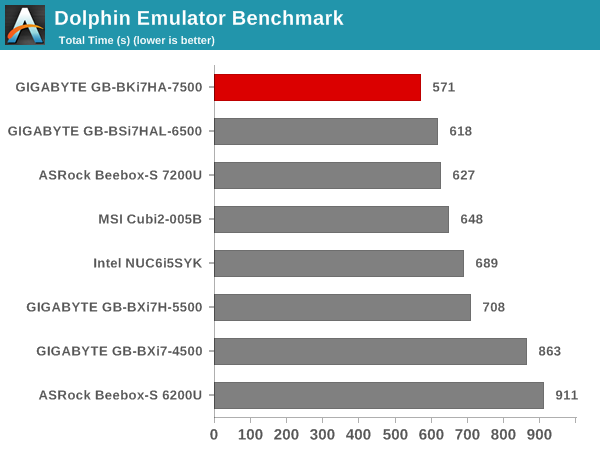
Dolphin Emulator
Wrapping up our application benchmark numbers is the Dolphin Emulator benchmark mode results. This is again a test of the CPU capabilities, and the BRIX easily comes out on top amongst the considered PCs.
Networking and storage are two major aspects which influence our experience with any computing system. This section presents results from our evaluation of these aspects in the GIGABYTE GB-BKi7HA-7500. On the storage side, one option would be repetition of our strenuous SSD review tests on the drive(s) in the PC. Fortunately, to avoid that overkill, PCMark 8 has a storage bench where certain common workloads such as loading games and document processing are replayed on the target drive. Results are presented in two forms, one being a benchmark number and the other, a bandwidth figure. We ran the PCMark 8 storage bench on selected PCs and the results are presented below.
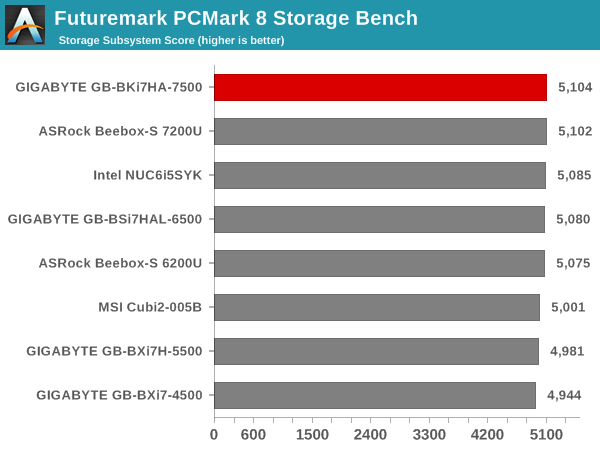
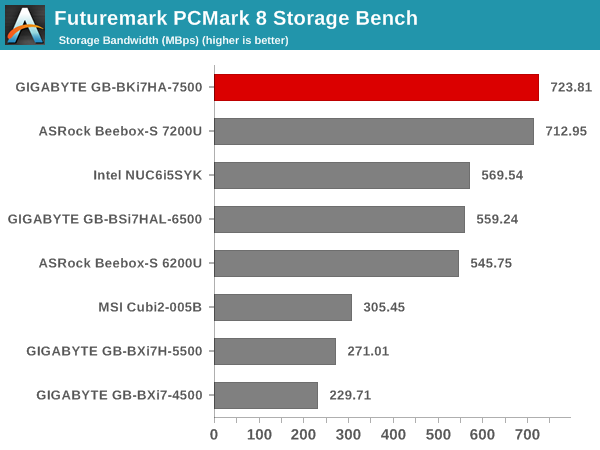
The combination of the CPU (Core i7-7500U) and the PCIe 3.0 x4 NVMe SSD (Samsung SSD 950 Pro) ensures that the GB-BKi7HA-7500 comes out on top in both the storage bench score and the storage bandwidth metrics for the PCMark 8 storage workloads.
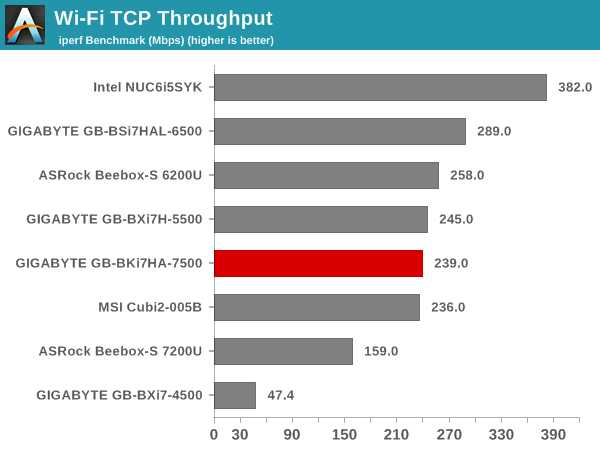
On the networking side, we restricted ourselves to the evaluation of the WLAN component. Our standard test router is the Netgear R7000 Nighthawk configured with both 2.4 GHz and 5 GHz networks. The router is placed approximately 20 ft. away, separated by a drywall (as in a typical US building). A wired client is connected to the R7000 and serves as one endpoint for iperf evaluation. The PC under test is made to connect to either the 5 GHz (preferred) or 2.4 GHz SSID and iperf tests are conducted for both TCP and UDP transfers. It is ensured that the PC under test is the only wireless client for the Netgear R7000. We evaluate total throughput for up to 32 simultaneous TCP connections using iperf and present the highest number in the graph below.
In the UDP case, we try to transfer data at the highest rate possible for which we get less than 1% packet loss.
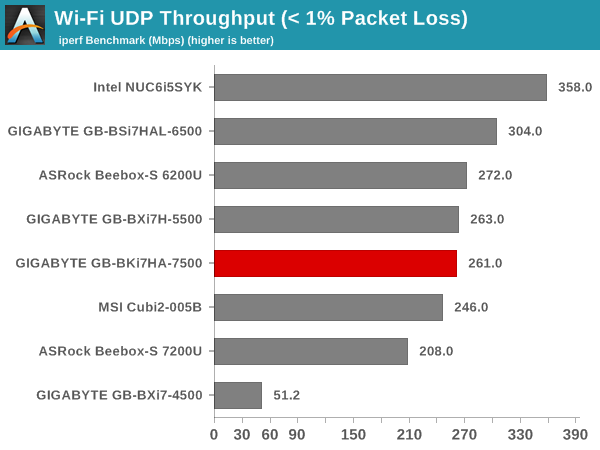
The 1×1 802.11ac adapter proves to be a weak link when compared with PCs such as the Intel NUC6i5SYK. We would have definitely preferred a 2×2 WLAN configuration for a flagship BRIX like the GB-BKi7HA-7500.
The GIGABYTE GB-BKi7HA-7500 is an actively cooled PC. The fan curves in the BIOS are also quite aggressive, making it a bit more noisy compared to other Kaby Lake-U PCs that we have evaluated before. As such, it is not a perfect HTPC. However, it does support 4K Netflix (like the ASRock Beebox-S 7200U). Some readers had also requested madVR performance testing with the Intel HD Graphics 620. Given these aspects, we thought it would be worthwhile to look at the HTPC aspects of the PC.
Refresh Rate Accuracy
Starting with Haswell, Intel, AMD and NVIDIA have been on par with respect to display refresh rate accuracy. The most important refresh rate for videophiles is obviously 23.976 Hz (the 23 Hz setting). As expected, the GIGABYTE GB-BKi7HA-7500 has no trouble with refreshing the display appropriately in this setting.

The gallery below presents some of the other refresh rates that we tested out. The first statistic in madVR’s OSD indicates the display refresh rate.


Network Streaming Efficiency
Evaluation of OTT playback efficiency was done by playing back our standard YouTube test stream and five minutes from our standard Netflix test title. Using HTML5, the YouTube stream plays back a 1080p encoding. Since YouTube now defaults to HTML5 for video playback, we have stopped evaluating Adobe Flash acceleration. Note that only NVIDIA exposes GPU and VPU loads separately. Both Intel and AMD bundle the decoder load along with the GPU load. The following two graphs show the power consumption at the wall for playback of the HTML5 stream in Mozilla Firefox (v 51.0.1). The graphs below show that our BRIX configuration is not a particularly power-efficient one for OTT streaming. It is obviously possible to lower these numbers by using a SATA SSD and a single SODIMM without any performance or feature set loss for OTT streaming workloads.
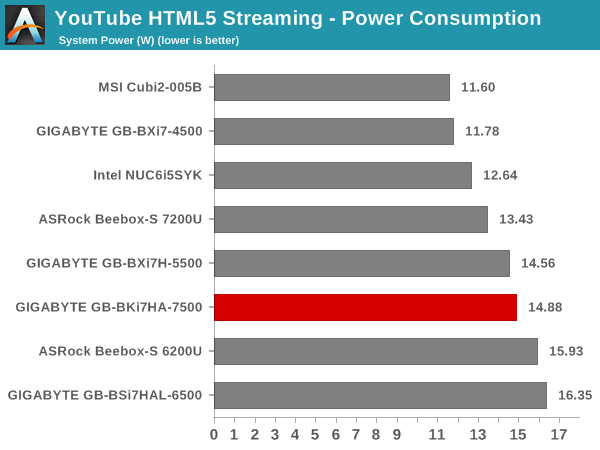
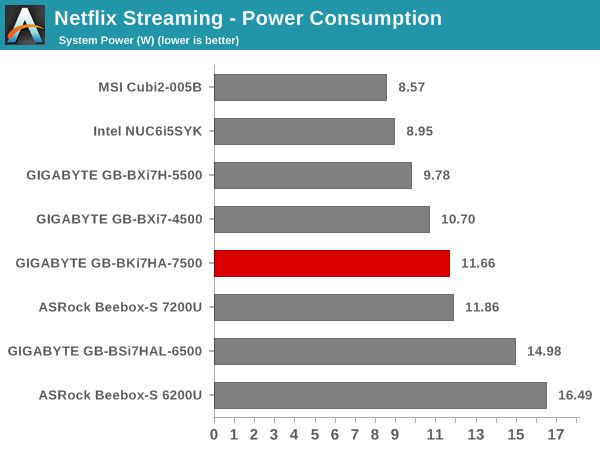
GPU load was around 14.1% for the YouTube HTML5 stream and 0.01166% for the steady state 6 Mbps Netflix streaming case.
Netflix streaming evaluation was done using the Windows 10 Netflix app. Manual stream selection is available (Ctrl-Alt-Shift-S) and debug information / statistics can also be viewed (Ctrl-Alt-Shift-D). Statistics collected for the YouTube streaming experiment were also collected here.
Decoding and Rendering Benchmarks
We have already seen in our previous KBL-U UCFF PC reviews that the Intel HD Graphics 620 has absolutely no trouble with video playback using either Kodi or MPC-HC’s default EVR-CP renderer. In order to present a different perspective, we decided to evaluate a madVR configuration as well as the latest Kodi release (Kodi 17.1 RC) on the GB-BKi7HA-7500.
Under madVR (0.91.7), we used the DXVA2 scaling logic wherever applicable (as it is known to be the best choice for Intel IGPs). For scaling situations where the dedicated scaler inside the GPU couldn’t be used, we chose Jinc. The rest of the madVR settings were left at default. MPC-HC 1.7.11 was used for playback, and LAV Filters 0.69 was configured in the native DXVA2 mode for the decoder.
In our earlier reviews, we focused on presenting the GPU loading and power consumption at the wall in a table (with problematic streams in bold). Starting with the Broadwell NUC review, we decided to represent the GPU load and power consumption in a graph with dual Y-axes. Elevent different test streams of 90 seconds each were played back with a gap of 30 seconds between each of them. The characteristics of each stream are annotated at the bottom of the graph. Note that the GPU usage is graphed in red and needs to be considered against the left axis, while the at-wall power consumption is graphed in blue and needs to be considered against the right axis. The GPU power consumption as reported by the processor is also recorded in green.
Frame drops are evident whenever the GPU load consistently stays above the 85 – 90% mark. We find that the GB-BKi7HA-7500 can’t handle scenarios where upscaling is required (we use a 1080p display for this evaluation). However, 1080i/p and 4K content were decoded and rendered without any issues.

We also performed a similar evaluation with Kodi 17.1RC in its default configuration. Kodi has absolutely no issues in playing back our test streams.

Kaby Lake-U has one of the most comprehensive codec supports in the market after Intel decided to add HEVC 8b and 10b full hardware decode. In fact, there is also support for 10-bit VP9 in the GPU. It is a pity that the display engine still doesn’t support HDMI 2.0 natively. However, GIGABYTE has integrated a LSPCon and ensured that the lack of native support is not a problem for the GB-BKi7HA-7500.
The power consumption at the wall was measured with a 1080p display being driven through the HDMI port. In the graphs below, we compare the idle and load power of the GIGABYTE GB-BKi7HA-7500 with other low power PCs evaluated before. For load power consumption, we ran the AIDA64 System Stability Test with various stress components, as well as our custom power virus test (a combination of Prime95 and Furmark) and noted the maximum sustained power consumption at the wall.
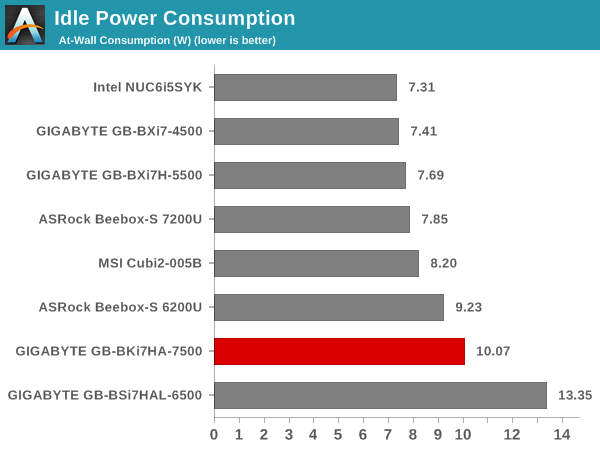
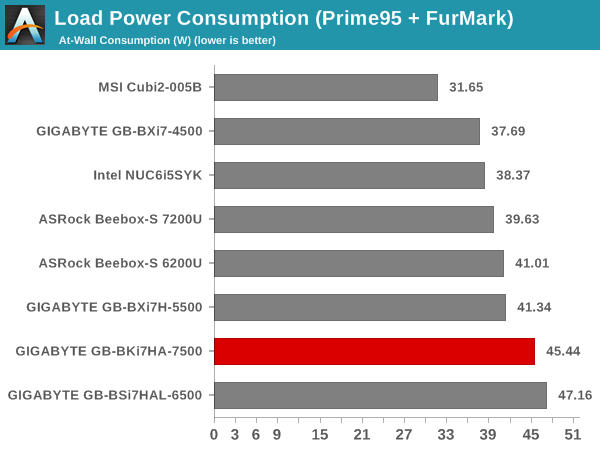
The idle power numbers are typical of a UCFF PC configured with a NVMe SSD. The sustained load power consumption is also similar to the Core i7-based units that we have evaluated before.
Our thermal stress routine starts with the system at idle, followed by four stages of different system loading profiles using the AIDA64 System Stability Test (each of 30 minutes duration). In the first stage, we stress the CPU, caches and RAM. In the second stage, we add the GPU to the above list. In the third stage, we stress the GPU standalone. In the final stage, we stress all the system components (including the disks). Beyond this, we leave the unit idle in order to determine how quickly the various temperatures in the system can come back to normal idling range. The various clocks, temperatures and power consumption numbers for the system during the above routine are presented in the graphs below. The important things to note include the core temperature steering well below the maximum junction temperature, and the chassis / thermal design being able to easily handle the specified 15W package power without throttling.

[

We repeated the same observations with our legacy stress test using the latest versions of Prime95 and Furmark – Prime95 v28.10 for 30 minutes (after launching with the max. stress option), followed by Furmark v1.18.20 for 30 minutes. The Prime95 load is then removed, allowing just the GPU alone to be stressed for 30 minutes. The system is then left idle.


According to the official specifications, the junction temperature of the Core i7-7500U is 100 C. Despite our power virus test being quite stressful, the thermal solution is able to keep the core temperature below 90C. We see that the system is basically limited by the package power. A sustained 15W load is easily handled by the cooling solution. We can see that the BIOS is set up to allow 25W for up to 5 seconds, and 18 W for up to 45 seconds before settling down to the 15W level.
We have reviewed at least one BRIX in each generation over the last four years. Using Skylake, GIGABYTE launched a wide range of solutions targeting different market segments within the UCFF space. The Kaby Lake version of their BRIX-H lineup builds upon that success by tweaking a few of the Skylake models to provide consumers with more choices (while taking advantage of some new Kaby Lake features). Compared to other Kaby Lake UCFF PCs such as the MSI Cubi2-005B and the ASRock Beebox-S 7200U, GIGABYTE’s KBL-U BRIX lineup has a number of advantages.
The KBL-U BRIX units provide user-friendly support for M.2 2280 PCIe NVMe drives. The Cubi2-005B doesn’t support M.2 2280 drives at all, while the Beebox-S needs a riser due to its smaller chassis dimensions. In addition, unlike the GB-BKi7HA-7500, the Beebox-S doesn’t have thermal pad protection for the M.2 SSD.
The KBL-U BRIX H units (such as the GB-BKi7HA-7500 that we have reviewed here) offers simplified installation and cable management for 2.5″ drives. The SATA power and data cables are integrated and come pre-installed on the board. In the other two UCFF PCs that we have reviewed before, the power header and data cable are separate and a pain to install within the space constraints imposed by the form factor.
GIGABYTE provides more choices to the end user, with the right unit for purchase being dependent on the intended use-case. The KBL-U BRIX lineup has Core i3, i5 and i7 varieties, while the Beebox-S has only the first two. The Cubi2 lineup does have all the three, but, GIGABYTE outscores MSI by having a Thunderbolt option as well. In addition, GIGABYTE has USB 3.1 Gen 2 on all their Kaby Lake BRIX units. The Cubi2 doesn’t have it in any of their offerings.
The KBL-U BRIX units support HDCP 2.2. They can be used to play back Netflix 4K content. Unlike the MSI Cubi2-005B, the GB-BKi7HA-7500 does have a LSPCon for HDMI 2.0 output with HDCP 2.2 capability. Like the Beebox-S 7200U, the GIGABYTE BRIX unit can also deliver 4K Netflix – one of the primary reasons that make Kaby Lake mini-PCs attractive for use as a HTPC.
Despite the above positives, there are certain areas that GIGABYTE can improve upon. The UEFI BIOS is pretty basic, particularly when compared to ASRock’s Beebox BIOS. The latter features more fine-grained user control over the DRAM timing settings, online automatic BIOS updates and other value additions. The system also needs a better sound profile. Subjectively speaking, the fan in the GB-BKi7HA-7500 makes more noise compared to the other two UCFF PCs that we have analyzed before. The choice of fan, as well as the default fan curves in the BIOS, needs some attention from GIGABYTE. Finally, a flagship UCFF PC with a Core i7 processor definitely needs a 2×2 802.11ac WLAN solution. GIGABYTE should upgrade to either the Intel AC8260 or AC8265 from the currently install Intel AC3168 solution.

The GIGABYTE GB-BKi7HA-7500 has a selling price of $ 500 on Newegg. But, the Thunderbolt version with an additional SDXC slot is just $ 10 more. Given that the version that we reviewed does not seem to be stocked anywhere in the US, it is a no-brainer to go with the GB-BKi7HT-7500 and get similar performance with additional future-proofing (Thunderbolt 3) capabilities. Given the absence of any significant premium for the Thunderbolt version, we believe GIGABYTE should focus only on Alpine Ridge (instead of the ASMedia ASM1142) for USB 3.1 Gen 2 support in the BRIX lineup.
All said, the GIGABYTE GB-BKi7HA-7500 is a compact and feature-rich Kaby Lake UCFF PC. In fact, considering the price and feature sets of all the KBL-U mini-PCs currently in the market, the GIGABYTE GB-BKi7HT-7500 (not the GB-BKi7HA-7500 that we have reviewed here) presents the best value for money.
Autore: AnandTech