
Author: Johan De Gelas AnandTech
A little less than 2 years ago, we investigated the first Arm server SoC that had a chance to compete with midrange Xeon E5s: the Cavium ThunderX. The SoC showed promise, however the low single-threaded performance and some power management issues relegated the 48-core SoC to more niche markets such as CDN and Web caching. In the end, Cavium’s first server SoC was not a real threat to Intel’s Xeon.
But Cavium did not give up, and rightfully so: the server market is more attractive than ever. Intel’s datacenter group is good for about 20 Billion USD (!) in revenue per year. And even better, profit margins are in 50% range. When you want to profits and cash flow, the server market far outpaces any other hardware market. So following the launch of the ThunderX, Cavium promised to bring out a second iteration: better power management, better single thread performance and even more cores (54).
The trick, of course, is actually getting to a point where you can take on the well-oiled machine that is Intel. Arm, Calxeda, Broadcom, AppliedMicro and many others have made many bold promises over the past 5 years that have never materialized, so there is a great deal of skepticism – and rightfully so – towards new Arm Server SoCs.
However, the new creation of underdog Cavium deserves the benefit of the doubt. Much has changed – much more than the name alone lets on – as Cavium has bought the “Vulcan” design from Avago. Vulcan is a rather ambitious CPU design which was originally designed by the Arm server SoC team of Broadcom, and as a result has a much different heritage than the original ThunderX. At the same time however, based on its experience from the ThunderX, Cavium was able to take what they’ve learned thus far and have introduced some microarchitectural improvements to the Vulcan design to improve its performance and power.
As a result, ThunderX2 is a much more “brainiac” core than the previous generation. While the ThunderX core had a very short pipeline and could hardly sustain 2 instructions per clock, the Vulcan core was designed to fetch 8 and execute up to 4 instructions per clock. It gets better: 4 simultaneous threads can be active (SMT4), ensuring that the wide back-end is busy most of the time. 32 of those cores at clockspeeds up to 2.5 GHz find a home in the new ThunderX2 SoC.
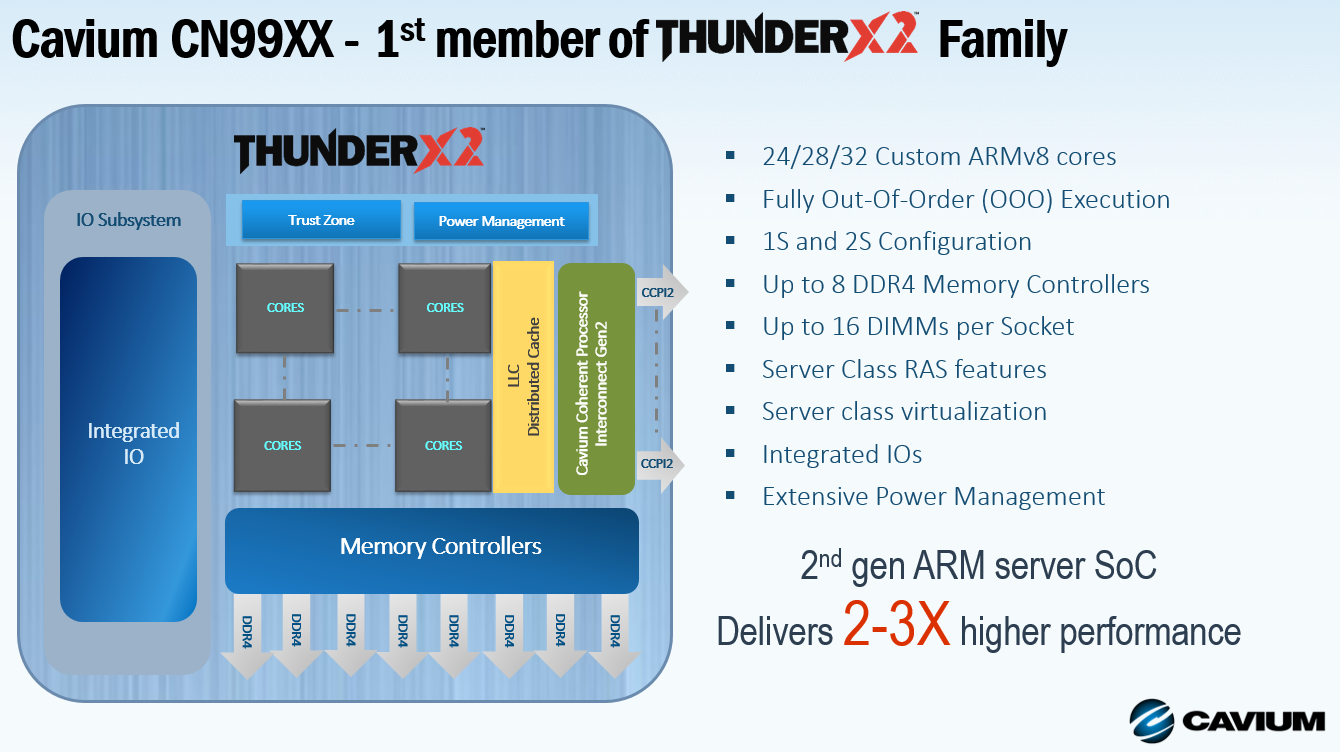
With up to 128 threads running and no less than eight DDR4 controllers, this CPU should be able to perform well in all server situations. In other words, while the ThunderX (1) was relegated to niche roles, the ThunderX2 is the first Arm server CPU that has a chance to break the server market open.
Thirty-two high-IPC cores in one package sounds promising. But how does the best ThunderX2 compare to what AMD, Qualcomm and Intel have to offer? In the table below we compare the high level specifications of several top server SKUs.
| Comparison of Major Server SKUs | |||||
| AnandTech.com | Cavium ThunderX2 9980-2200 |
Qualcomm Centriq 2460 |
Intel Xeon 8176 |
Intel Xeon 6148 |
AMD EPYC 7601 |
| Process Technology | TSMC 16 nm |
Samsung 10 nm |
Intel 14 nm |
Intel 14 nm |
Global Foundries 14 nm |
| Cores | 32 Ring bus |
48 Ring bus |
28 Mesh |
20 Mesh |
4 dies x 8 cores MCM |
| Threads | 128 | 48 | 56 | 40 | 64 |
| Max. number of sockets | 2 | 1 | 8 | 4 | 4 |
| Base Frequency | 2.2 GHz | 2.2 GHz | 2.2 GHz | 2.4 GHz | 2.2 GHz |
| Turbo Frequency | 2.5 GHz | 2.6 GHz | 3.8 GHz | 3.7 GHz | 3.2 GHz |
| L3 Cache | 32 MB | 60 MB | 38.5 MB | 27.5 MB | 8×8 MB |
| DRAM | 8-Channel DDR4-2667 |
6-Channel DDR4-2667 |
6-Channel DDR4-2667 |
6-Channel DDR4-2667 |
8-Channel DDR4-2667 |
| PCIe 3.0 lanes | 56 | 32 | 48 | 48 | 64 |
| TDP | 180W | 120 W | 165W | 150W | 180W |
| Price | $ 1795 | $ 1995 | $ 8719 | $ 3072 | $ 4200 |
Astute readers will quickly remark that Intel’s top of the line CPU is the Xeon Platinum 8180. However that SKU with its 205W TDP and $ 10k+ price tage is not comparable at all to any CPU in the list. We are already going out on a limb by including the 8176, which we feel belongs in this list of maximum core/thread count SKUs. In fact, as we will see further, Cavium positions the Cavium 9980 as “comparable” to the Xeon Platinum 8164, which is essentially the same part as the 8176 but with slightly lower clockspeeds.
However, it terms of performance per dollar, Cavium typically compares their flagship 9980 to the Intel Xeon Gold 6148, against which the pricing of Cavium’s CPU is very aggressive. Many of Cavium’s benchmarks claim that the fastest ThunderX2 is 30% to 40% ahead of the Xeon 6148, all the while Cavium’s offering comes in at $ 1300 less. That aggressive pricing might explain the increasingly persistent rumors that Qualcomm is not going to enter the server market after all.
When looking at the table above, you can already see some important differences between the contenders. Intel seems to have the most advanced core topology and the highest turbo clockspeed. Meanwhile Qualcomm has the best chances when it comes to performance per watt, and has already published some benchmarking data that underlines this advantage.
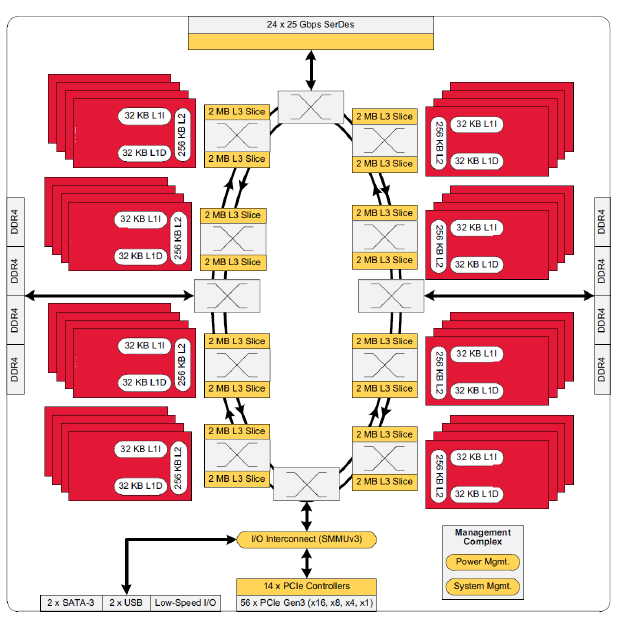
Similar to AMD’s EPYC, Cavium’s ThunderX2 is likely to shine in the “sparse matrix” HPC market. This is thanks to its 33% greater theoretical memory bandwidth and a high core/thread count. However as we’ve seen in the case of AMD’s design, EPYC’s L3-cache is slow once you need data that is not in the local 8 MB cache slice. The ThunderX2, by comparison, is a lot more sophisticated with a dual ring architecture, which seems to be similar to the ring architecture of the Xeon v4 (Broadwell-EP). According to Cavium, this ring structure is able to offer up to 6 TB/s of bandwidth and is non-blocking.
This ring architecture is connected to Cavium’s Coherent Processor Interconnect (CCPI2 – at the top of the picture), which runs at 600 Gb/sec. This interconnect links the two sockets/NUMA nodes. Also connected to the ring are the SoC’s 56 PCIe 3.0 lanes, which Cavium allocates among 14 PCIe “controllers.”. These 14 controllers can, in turn, be bifurcated down to x4 or x1 as you can see below.
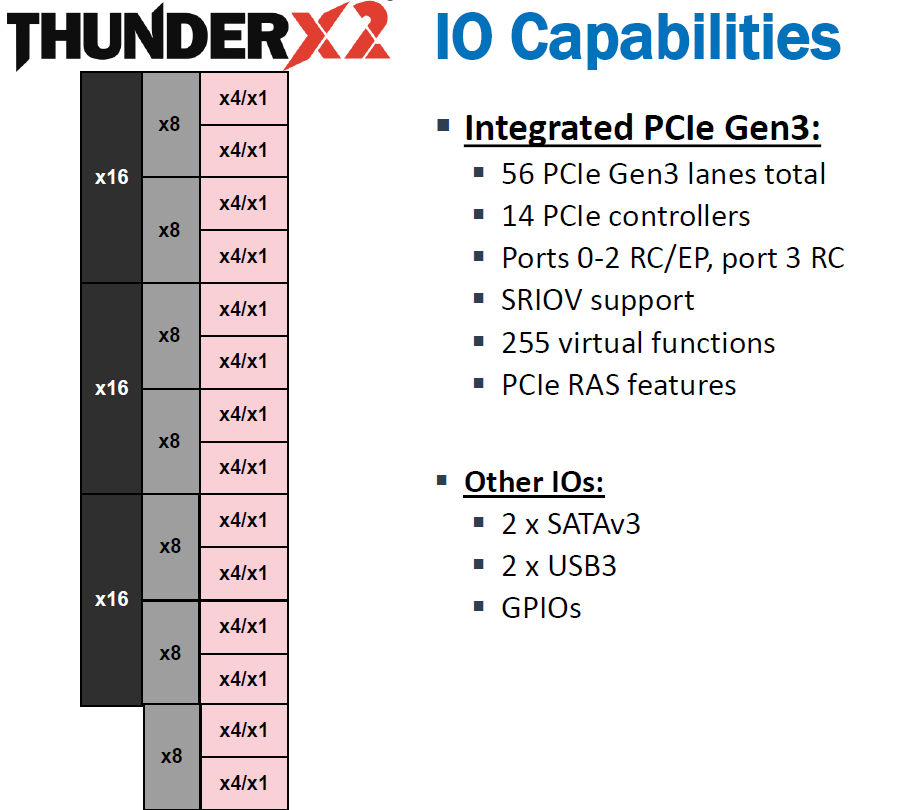
SR-IOV, which is important for I/O virtualization (Xen and KVM), is also supported.
As a brief recap, the original ThunderX was an improved version of the Octeon III: a dual-issue in-order CPU core with two short pipelines.
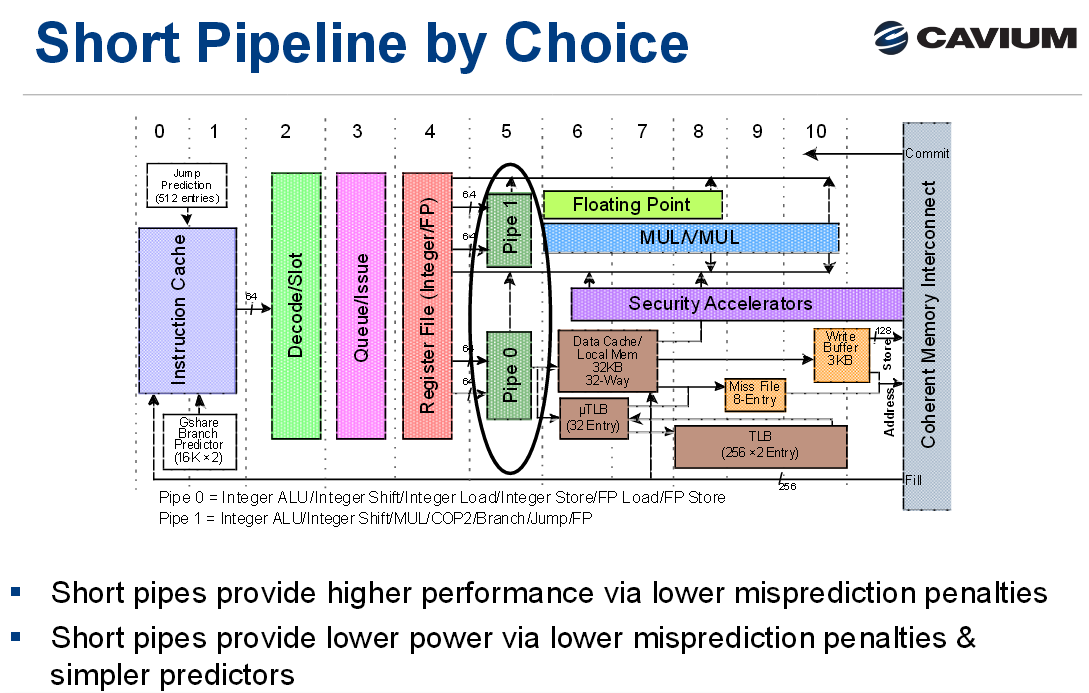
The advantage of the original ThunderX design is that such a simple core can be very energy efficient, especially for “low ILP” (instruction level parallelism) workloads such as web servers and most database servers. Of course, such a short pipeline limits the clockspeed, and such a simple in-order design offers low single threaded performance in medium and high ILP workloads, whereas more advanced out-of-order processors can extract significant parallelism.
Cavium’s “New” Core: Vulcan
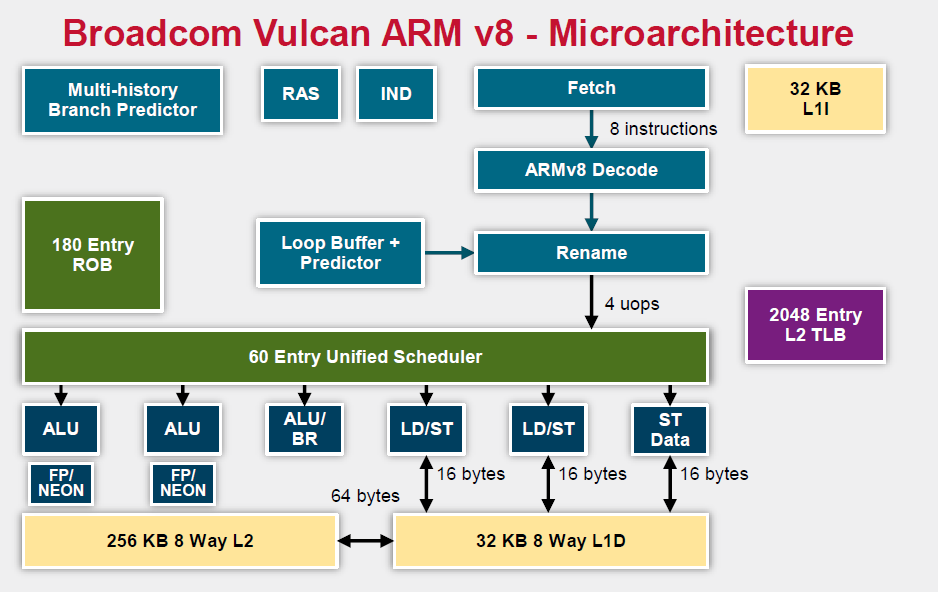
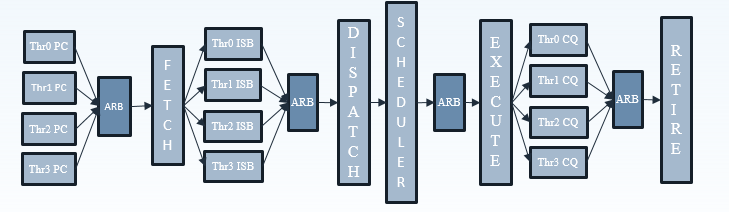
Relative to the original ThunderX, the Vulcan core of the ThunderX2 is an entirely different beast. Announced in 2014 by Broadcom, it is a relatively wide core that runs 4 simultaneous threads (SMT4). As a result, the wide back end should be quite busy even when running low-ILP server workloads.
To make sure that all 4 SMT threads can be sustained, the ThunderX2 front-end can fetch up to 64 bytes from the 8-way set associative 32 KB instruction cache, which is outfitted with a simple next line prefetcher. However, fetching 8 instructions is only possible if there is no taken branch inside those 64 bytes. In that case, the fetch breaks off at the taken branch.
That means that in branch intensive code (databases, AI…) the fetcher will get +/- 5 instructions per clock cycle on average, as one out of 5 instructions is a branch. The fetched instructions are then sent to a smoothing buffer – a buffer where the fetched instructions are held for decoding.
The decoder will then work on a bundle of 4 instructions. Between the decoder and the rename phase each thread has “skid buffer” which consists of 8 bundles. So between the 4 threads up to 32 bundles (128 instructions) can be skid buffered at any one time..
Those 4 instructions – a bundle – travel together through the pipeline until they reach the unified issue queue of the scheduler. Just like Intel has implemented in Nehalem, there is also a loop buffer and predictor, which Intel used to call a “Loop Stream Detector”. This loop buffer avoids branch mispredictions and contains decoded µops, which “shortens” the pipeline and reduces the amount of power spent on decoding.
Overall, up to 6 instructions can be executed at the same time. This is divided into 2 ALU/FP/NEON slots, 1 ALU/branch slot, 2 load/store slots (16 bytes), and 1 pure store slot that sends 16 bytes to the D-cache. There is a small (Cavium would not disclose how small) L1 TLB for zero latency translation from Virtual to physical addresses. There is no hardware prefetcher for the L1 D-cache, but the L2 cache has a rather complex hardware prefetcher which is able to recognize patterns (besides being able to stride or fetching the next line).
This is enough to feed the back-end, which can sustain 4 instructions per cycle from 4 different threads.
Ultimately Cavium has only published a limited amount of information on the ThunderX2 cores, so there are some limits to our knowledge. But we’ve gone ahead and summarized some of the key specifications of the different CPU architectures below.
| Feature | Cavium ThunderX2 |
Qualcomm Centriq “Falkor” |
Intel “Skylake”-SP |
AMD EPYC “Zen” |
| L1-I cache Associativity |
32 KB 8-way |
64KB 8-way (+ 24 KB L0) |
32 KB 8-way |
64KB 4-way |
| L1-D cache Associativity |
32 KB 8-way |
32 KB 8-way* |
32 KB 8-way |
32 KB 8-way |
| Load Bandwith | 2x 16B | 2x 16B | 2x 32B | 2x 16B |
| L2-cache | 256 KB 8-way |
256 KB 8-way |
512 KB 8-way |
512 KB 8-way |
| Fetch Width | 8 instructions | 4 instructions | 16 bytes (+/- 4-5 x86) | 32 bytes (+/- 6-8 x86) |
| Issue Queue | 60 | 76 | 97 unified | 6×14 |
| Sustainable Instructions/cycle | 4 | 4 | 5-6 | 4-5 |
| Instructions in Flight | 180 (ROB) | 128 | 224 (ROB) | 192 |
| Int. Pipeline Length |
? |
15 stages | 19 stages 14 stage from µop cache |
19 stages? |
| TLB Instructions TLB Data |
“Small L1” + 2048 unified L2 | ? 64+512 |
128 64 +1536 Unified |
8+64+512 64+1532 |
A detailed analysis is out of the scope of this article. But you can read Ian’s analyses of the Falkor, Skylake and Zen architectures here at AnandTech. We limit ourselves to the most obvious differences.
It is pretty clear that Intel’s single-threaded performance remains unchallenged: the Skylake core is the widest core, keeps the most instructions in flight, and most importantly runs at the highest clockspeed. The ThunderX2 core is the one that fetches the most instructions per cycle, as it has to be able to keep 4 threads running. The fetch unit will grab 8 instructions from one thread, than grab 8 from the second thread and it will keep cycling between threads. A bad prediction could thus lower the performance of single thread significantly.
The SKU inside our test system was the ThunderX2 CN9980 2.2. This is the top SKU that is available right now, offering 32 cores at 2.2 GHz, which are able to further boost to 2.5 GHz.
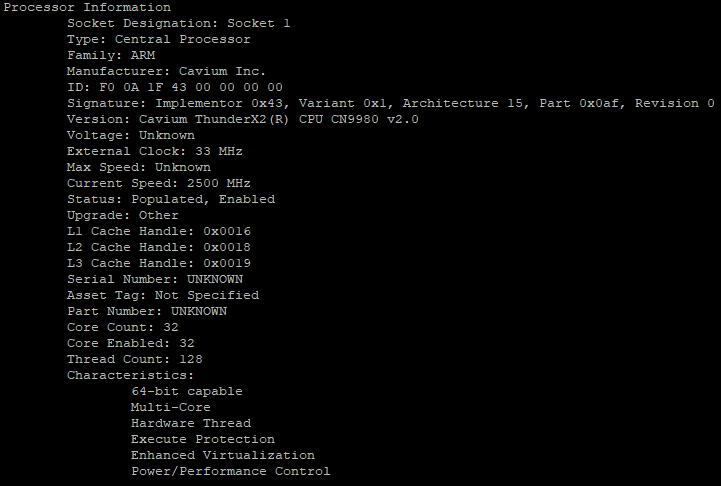
According to Cavium’s plans, many more SKUs will be available in the coming months. Cavium claims that a CN9980 at 2.5 GHz will be available soon, which would be capable of boosting to 3 GHz.
Cavium has listed all of their planned SKUs together alongside the comparable Intel SKU. By Cavium’s definition, a comparable Intel SKU is a chip that achieves the same SPECInRate (2017) under gcc as Cavium’s SKU.
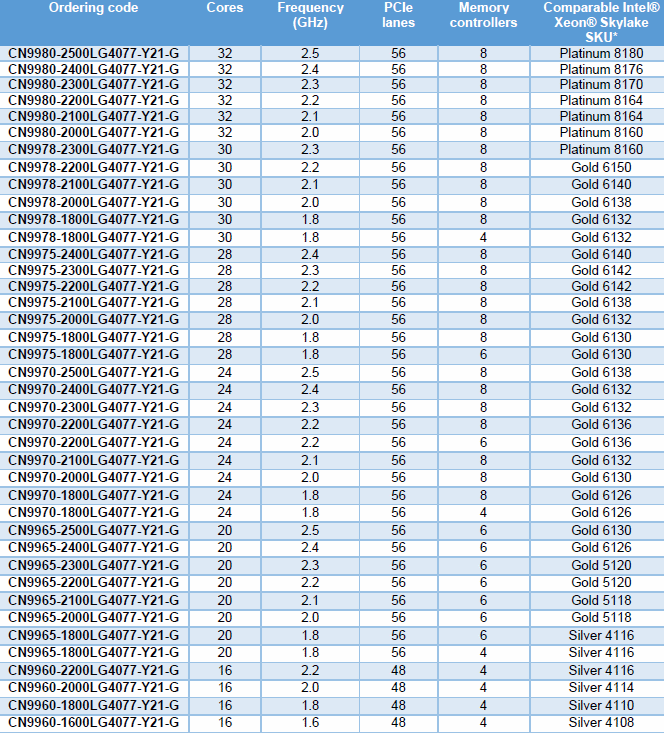
As you can see, Cavium considers our CN9880 2.2 to be comparable to the much more expensive 8164. For our testing we will compare it to the 8176, as that was the Intel SKU available to us. Not that it should matter much: the 8176 only has a 3% higher clockspeed and 2 additional cores (+7%) over the 8164. Note however that if Cavium’s ThunderX2 can really compete with these Intel SKUs, they are offering the same performance at one third of the cost of the Intel SKUs.
For our look at the ThunderX2, all of our testing was conducted on Ubuntu Server 17.10, Linux kernel 4.13 64 bit. Normally we would use an LTS version, but since the Cavium shipped with that Ubuntu version, we did not want to take any unnecessary risks by changing the OS. The compiler that ships with this distribution is GCC 7.2.
Unfortunately however, our AMD EPYC system has missed the deadline for this article. We ran into problems with that system right up to press time and are still debugging the matter. But in short, the system did not perform well after we performed a kernel upgrade.
Finally, you will notice that the DRAM capacity varies among our server configurations. The reason is simple: Intel’s system has 6 memory channels, while Cavium’s ThunderX2 has 8 memory channels.
| CPU | Two Cavium ThunderX2 CN9980 (32 cores at 2.2 – 2.5 GHz) |
| RAM | 512 GB (16x32GB) Micron Reg. DDR4 @2666 |
| Internal Disks | SANDISK Cloudspeed Gen II 800 GB |
| Motherboard | Cavium Sabre |
| BIOS version | 18/2/2018 |
| PSU | Dual 1600W 80+ Platinum |
| CPU | Two Intel Xeon Platinum 8176 (28 cores at 2.1 GHz, 165W) |
| RAM | 384 GB (12×32 GB) Hynix DDR4-2666 |
| Internal Disks | SAMSUNG MZ7LM240 (bootdisk) Intel SSD3710 800 GB (data) |
| Motherboard | Intel S2600WF (Wolf Pass baseboard) |
| Chipset | Intel Wellsburg |
| BIOS version | 9/02/2017 |
| PSU | 1100W PSU (80+ Platinum) |
The typical BIOS settings can be seen below. I should also note that we have both hyperthreading and Intel’s virtualization technology enabled.
Other Notes
Both servers are fed by a standard European 230V (16 Amps max.) power line. The room temperature is monitored and kept at 23°C by our Airwell CRACs.
One thing that concerned us was the fact that the Gigabyte “Saber” system consumed 500W while simply running Linux (so mostly idle). Under load however the system consumed around 800W, which is in line with our expectations, as we have two 180W TDP chips inside. So as is typically the case for early test systems, we are not able to do any accurate power comparisons.
In fact, Cavium claims that the actual systems from HP, Gigabyte and others will be far more power efficient. The “Sabre” testing system we received had several power management problems: immature fan management firmware, a BMC bug, and an oversized (1600W) PSU.
Measuring the full bandwidth potential of a system with John McCalpin’s Stream bandwidth benchmark is getting increasingly difficult on the latest CPUs, as core and memory channel counts have continued to grow. As you can see from the results below, it not easy to measure bandwidth. The result vary wildly depending on the setting you choose.
| Memory: STREAM Bandwidth | ||
| Mem Hierarchy |
Compiler & OS settings | Result |
| Cavium ThunderX2 Gcc 7.2 binary |
-O2 -mcmodel=large -fopenmp -DVERBOSE -fno-PIC” OMP_PROC_BIND=spread |
241 GB/s |
| Cavium ThunderX2 Gcc 7.2 binary |
-Ofast -fopenmp -static OMP_PROC_BIND=spread |
157 GB/s |
| Cavium ThunderX2 Gcc 7.2 binary |
OMP_PROC_BIND not configured | 118 GB/s |
| Intel ICC Binary | -fast -qopenmp -parallel KMP_AFFINITY=verbose,scatter |
183 GB/s |
| Intel gcc Binary | Ofast -fopenmp -static OMP_PROC_BIND=spread |
151 GB/s |
| Intel gcc Binary | Ofast -fopenmp -static OMP_PROC_BIND not configured |
150 GB/s |
Theoretically, the ThunderX2 has 33% more bandwidth available than an Intel Xeon, as the SoC has 8 memory channels compared to Intel’s six channels. These high bandwidth numbers can only be achieved in very specific conditions and require quite a bit of tuning to avoid reaching out to remote memory. In particular, we have to ensure that threads don’t migrate from one socket to the other.
We first tried to achieve the best results on both architectures. In case of Intel the ICC compiler always produced better results with some low level optimizations inside the stream loops. In case of Cavium, we followed the instructions of Cavium. So strictly speaking these are not comparable, but it should give you an idea of what kind of bandwidth these CPUs can achieve at their respective peaks. To be fair to Intel, with ideal settings (AVX-512) you should be able to achieve 200 GB/s.
Nevertheless, it is clear that the ThunderX2 system can deliver between 15% and 28% more bandwidth to its CPU cores. This works out to 235 GB/sec, or about 120 GB/sec per socket. Which in turn is about 3 times more than what the original ThunderX was capable off.
While Bandwidth measurements are only relevant to a small part of the server market, almost every application is heavily impacted by the latency of memory subsystem. To that end, we used LMBench in an effort to try to measure cache and memory latency. The numbers we looked at were “Random load latency stride=16 Bytes”. Note that we’re expressing the L3 cache and DRAM latency in nanoseconds since we don’t have accurate L3-cache clockspeed values.
| Memory: LMBench Latency | |||
| Mem Hierarchy |
Cavium ThunderX DDR4-2133 |
Cavium ThunderX2 DDR4-2666 |
Intel Skylake 8176 DDR4-2666 |
| L1-cache (cycles) | 3 | 4 | 4 |
| L2-cache (cycles) | 40/80 (*) | 8-9 | 12 |
| L3-cache 4-8 MB (ns) | N/A | 27-30 ns | 24-29 ns |
| Memory 384-512 (ns) | 103/206 (*) | 156-157 ns | 89-91 ns |
The L2-cache of the ThunderX2 is accessed with very little latency, and with a single thread running, the L3-cache is competitive with the Intel’s complex L3 cache. Once we hit the DRAM however, Intel offers significantly lower latency.
To get a deeper understanding of the respective architectures, we also ran the open source TinyMemBench benchmark. The source code was compiled with GCC 7.2 and the optimization level was set to “-O3”. The benchmark’s testing strategy is described rather well in its manual:
Average time is measured for random memory accesses in the buffers of different sizes. The larger the buffer, the more significant the relative contributions of TLB, L1/L2 cache misses, and DRAM accesses become. All the numbers represent extra time, which needs to be added to L1 cache latency (4 cycles).
We tested with single and dual random read (no huge pages), as we wanted to see how the memory system coped with multiple read requests.

One of the major weaknesses of the original ThunderX was that it did not support multiple outstanding misses. Memory level parallelism is an important feature for any high-performance modern CPU core: using it it avoids cache misses that would starve the wide back end. A non-blocking cache is thus a key feature for wide cores.
The ThunderX2 does not suffer from that problem at all, thanks to its non-blocking cache. Just like the Skylake core in the Xeon 8176, a second read causes the overall latency to increase by only 15-30%, and not 100%. According to TinyMemBench, the Skylake core has tangibly better latencies. The datapoint at 512 KB is of course easy to explain: the Skylake core is still fetching from its fast L2, while the ThunderX2 core has to access its L3. But the numbers at 1 and 2 MB indicate that Intel’s prefetchers offer a serious advantage as the latency stays is an averag of the L2 and the L3-cache. Around 8 to 16 MB, the latency numbers are close, but once we go beyond the L3 (64 MB), Intel’s Skylake offers lower memory latencies.
Getting down to measuring actual compute performance, we’ll start with the SPEC CPU2006 suite. Astute readers will point out that SPEC CPU2006 is now outdated as SPEC CPU2017 has arrived. But due to the limited testing time and the fact that we could not retest the ThunderX, we decided to stick with CPU2006.
Given that SPEC is almost as much of a compiler benchmark as it is a hardware benchmark, we believe it’s important to lay out our testing philosophy here. In this case, that using specific flags and other compiler settings just to inflate a benchmark’s score does not lead to meaningful comparisons. So we want to keep the settings as “real world” as possible with the following settings (and we welcome constructive criticism on the matter):
- 64 bit gcc: most used compiler on Linux, good all round compiler that does not try to “break” benchmarks (libquantum…)
- -Ofast: compiler optimization that many developers may use
- -fno-strict-aliasing: necessary to compile some of the subtests
- base run: every subtest is compiled in the same way.
The first objective is to measure performance in applications where for some reason – as is frequently the case – a “multi-threading unfriendly” task keeps us waiting. Our second objective is to understand how well the ThunderX OOO architecture deals with a single thread compared to Intel’s Skylake architecture. Keep in mind that this specific model Skylake chip can boost to 3.8 GHz. The chip will run at 2.8 GHz in almost all situations (28 threads active), and will sustain 3.4 GHz with 14 active threads.
Overall, Cavium positions the ThunderX2 CN9980 ($ 1795) as being “better than the 6148” ($ 3072), a CPU that runs at 2.6 GHz (20 threads) and reaches 3.3 GHz without much trouble (up to 16 threads active). As a result, the Intel SKUs will have a sizable 30% clock advantage in many situations (3.3GHz vs 2.5GHz).
Cavium makes up for this clockspeed deficit by offering up to 60% more cores (32 cores) than the Xeon 6148 (20 cores). But we must note that higher core counts will result in diminishing returns in many applications (e.g. Amdahl). So if Cavium wants to threaten Intel’s dominant position with the ThunderX2, each core needs to at least offer competitive performance on a clock-for-clock. Or in this case, the ThunderX2 should deliver at least 66% (2.5 vs 3.8) of the single threaded performance of the Skylake. If that is not the case, Cavium must hope that the 4-way SMT bridges the gap.
| SPEC CPU2006: Single-Threaded | |||||
| Subtest SPEC CPU2006 Integer |
Application Type | Cavium ThunderX 2 GHz gcc 5.2 |
Cavium ThunderX2 @2.5 GHz gcc 7.2 |
Xeon 8176 @3.8 GHz gcc 7.2 |
ThunderX2 vs Xeon 8176 |
| 400.perlbench | Spam filter | 8.3 | 20.1 | 46.4 | 43% |
| 401.bzip2 | Compression | 6.5 | 14 | 25 | 56% |
| 403.gcc | Compiling | 10.8 | 26.7 | 31 | 86% |
| 429.mcf | Vehicle scheduling | 10.2 | 44.5 | 40.6 | 110% |
| 445.gobmk | Game AI | 9.2 | 15.7 | 27.6 | 57% |
| 456.hmmer | Protein seq. analyses | 4.8 | 22.2 | 35.6 | 62% |
| 458.sjeng | Chess | 8.8 | 15.8 | 30.8 | 51% |
| 462.libquantum | Quantum sim | 5.8 | 76.4 | 86.2 | 89% |
| 464.h264ref | Video encoding | 11.9 | 26.7 | 64.5 | 49% |
| 471.omnetpp | Network sim | 7.3 | 26.4 | 37.9 | 70% |
| 473.astar | Pathfinding | 7.9 | 15.6 | 24.7 | 63% |
| 483.xalancbmk | XML processing | 8.4 | 27.7 | 63.7 | 43% |
Without having the opportunity to do any profiling on the ThunderX2, we must humbly admit that we have to speculate a bit based on what we have read so far about these benchmarks. Furthermore, since the ThunderX2 is running ARMv8 (AArch64) code and the Xeon runs x86-64 code, the picture gets even blurrier.
The pointer chasing benchmarks – XML processing (also large OoO buffers necessary) and Path finding – which typically depend on a large L3-cache to lower the impact of access latency, are the worst performing on the ThunderX2. We can assume that the higher latency of DRAM system is hurting performance.
The workloads where the impact of branch prediction is higher (at least on x86-64: a higher percentage of branch misses) – gobmk, sjeng, hmmer – are not top performers either on the ThunderX2.
It’s also worth noting that perlbench, gobmk, hmmer, and the instruction part of h264ref are all known to benefit from the larger L2-cache (512 KB) of Skylake. We are only giving you a few puzzle pieces, but together they might help to make some educated guesses.
On the positive side, the ThunderX2 performs well on gcc, which runs mostly inside the L1 and L2-cache (thus relying on a low latency L2) and where the performance impact of the branch predictor is minimal. Overall the best subtest for the TunderX2 is mcf (vehicle scheduling in public mass transportation), which is known to miss the L1 data cache almost completely, relying a lot on the L2-cache, which is pretty fast on the ThunderX2. Mcf also demands quite a bit of memory bandwidth. Libquantum is the one with the highest memory bandwidth demand. The fact that Skylake offers rather mediocre single threaded bandwidth is probably also a reason why the ThunderX2 is so competitive on libquantum and mcf.
Moving beyond single-threaded performance, multi-threaded performance within the confines of a single core is of course also important. The Vulcan CPU architecture was designed from the start to leverage SMT4 to keep its cores occupied and boost their overall throughput, so this is where we’ll look next.
| SPEC CPU2006: Single Core w/SMT | ||||||
| Subtest SPEC CPU2006 Integer |
Application Type | Cavium ThunderX 2 GHz gcc 5.2 1 thread |
Cavium ThunderX2 @2.5 GHz gcc 7.2 4 threads |
Xeon 8176 @3.8 GHz gcc 7.2 2 threads |
Thunder X2 vs Xeon 8176 |
Thunder X2 vs ThunderX |
| 400.perlbench | Spam filter | 8.3 | 24.1 | 50.6 | 48% | 290% |
| 401.bzip2 | Compression | 6.5 | 22.9 | 31.9 | 72% | 350% |
| 403.gcc | Compiling | 10.8 | 35 | 38.1 | 92% | 330% |
| 429.mcf | Vehicle scheduling | 10.2 | 52.4 | 50.6 | 104% | 510% |
| 445.gobmk | Game AI | 9.2 | 25.1 | 35.6 | 71% | 270% |
| 456.hmmer | Protein seq. analyses | 4.8 | 26.7 | 41 | 65% | 560% |
| 458.sjeng | Chess | 8.8 | 22.4 | 37.1 | 60% | 250% |
| 462.libquantum | Quantum sim | 5.8 | 83.6 | 83.2 | 100% | 1440% |
| 464.h264ref | Video encoding | 11.9 | 34 | 66.8 | 51% | 290% |
| 471.omnetpp | Network sim | 7.3 | 31.1 | 41.1 | 76% | 440% |
| 473.astar | Pathfinding | 7.9 | 27.2 | 33.8 | 80% | 340% |
| 483.xalancbmk | XML processing | 8.4 | 33.8 | 75.3 | 45% | 400% |
First of all, the ThunderX2 core is a massive improvement over the simple ThunderX core. Even excluding libquantum – that benchmark could easily run 3 times faster on the older ThunderX core after some optimization and compiler improvements – the new ThunderX2 is no less than 3.7 times faster than its older brother. This kind of an IPC advantage makes the original ThunderX’s 50% core advantage all but irrelevant.
Looking at the impact of SMT, on average, we see that 4-way SMT improves the ThunderX2’s performance by 32%. This ranges from 8% for video encoding to 74% for pathfinding. Intel meanwhile gets a 18% boost from their 2-way SMT, ranging from 4% to 37% in the same respective scenarios.
Overall, a boost of 32% for the ThunderX2 is decent. But it does invite an obvious comparison: how does it fare relative to another SMT4 architecture? Looking at IBM’s POWER8, which also supports SMT4, at first glance there seems to be some room for improvement, as the POWER8 sees a 76% boost in the same scenario.
However this isn’t entirely an apples-to-apples comparison, as the IBM chip had a much wider back-end: it could issue 10 instructions while the ThunderX2 core is limited to 6 instructions per cycle. The POWER8 core was also much more power hungry: it could fit only 10 of those ultra-wide cores inside a 190W power budget on a 22 nm process. In other words, further increasing the performance gains from using SMT4 would likely require even wider cores, and in turn seriously impact the total number of cores available inside the ThunderX2. Still, it is interesting to put that 32% number into perspective.
The SPECjbb 2015 benchmark has “a usage model based on a world-wide supermarket company with an IT infrastructure that handles a mix of point-of-sale requests, online purchases, and data-mining operations.” It uses the latest Java 7 features and makes use of XML, compressed communication, and messaging with security.
Note that we upgraded from SPECjbb version 1.0 to 1.01.
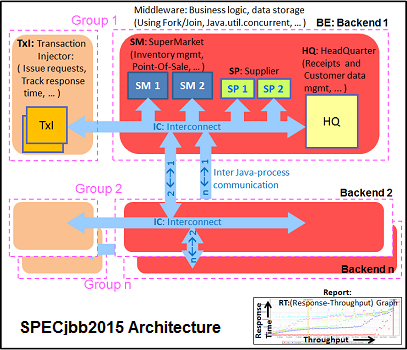
We tested SPECjbb with four groups of transaction injectors and backends. The reason why we use the “Multi JVM” test is that it is more realistic: multiple VMs on a server is a very common practice, especially on these 100+ threads servers. The Java version was OpenJDK 1.8.0_161.
Each time we publish SPECjbb numbers, several people tell us that our numbers are too low. So we decided to spend a bit more time and attention on the various settings.
However, it is important to understand that the SPECJbb numbers published by the hardware vendors are achieved with the following settings, which are hardly suitable for a production environment:
- Fiddling around with kernel settings like the timings of the task scheduler, page cache flushing
- Disabling energy saving features, manually setting c-state behavior
- Setting the fans at maximum speed, thus wasting a lot of energy for a few extra performance points
- Disabling RAS features (like memory scrub)
- Using a massive amount of Java tuning parameters. That is unrealistic because it means that every time an application is run on a different machine (which happens quite a bit in a cloud environment) expensive professionals have to revise these settings, which may potentially cause the application to halt on a different machine.
- Setting very SKU-specific NUMA settings and CPU bindings. Migrating between 2 different SKUs in the same cluster may cause serious performance problems.
We welcome constructive feedback, but in most production environments tuning should be simple and preferably not too machine-specific. To that end we applied two kinds of tuning. The first one is very basic tuning to measure “out of the box” performance, while aiming to fit everything inside a server with 128 GB of RAM:
For the second tuning, we went searching for the best throughput score, playing around with “-XX:+AlwaysPreTouch”, “-XX:-UseBiasedLocking”, and “specjbb.forkjoin.workers”. “+AlwaysPretouch” zeroes out all of the memory pages before starting up, lowering the performance impact of touching new pages. “-UseBiasedLockin” disables biased locking, which is otherwise enabled by default. Biased locking gives the thread that already has loaded the contended data in the cache priority. The trade-off for using biased locking is some additional bookkeeping within the system, which in turn incurs a small performance hit overall if that strategy was not the right one.
The graph below shows the maximum throughput numbers for our MultiJVM SPECJbb test.
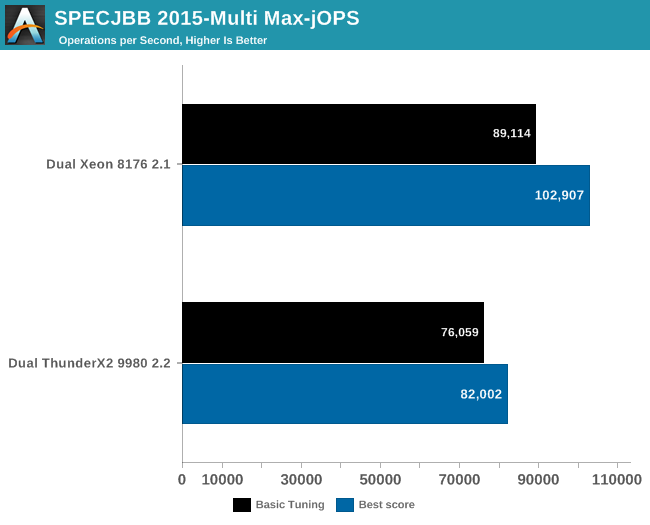
The ThunderX2 achieves 80& to 85% of the performance of the Xeon 8176. That should be high enough to beat the Xeon 6148. Interestingly, the top scores are achieved in different ways between the Intel and Cavium systems. In case of the Dual ThunderX2, we used:
Whereas the Intel system achieved best performance by leaving biased locking on (the default). We noticed that the Intel system – probably due to the relatively “odd” thread count – has a slightly lower average CPU load (a few percent) and a larger L3-cache, making biased locking a good strategy for the that architecture.
Finally, we have Critical-jOPS, which measures throughput under response time constraints.
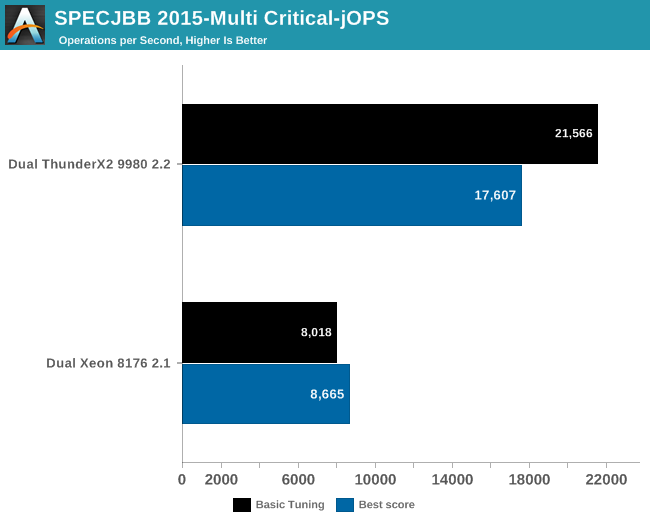
With this many threads active, you can get much higher Critical-jOPS by significantly increasing the RAM allocation per JVM. However, it really surprising to see that the Dual ThunderX2 system – with its higher thread count and lower clockspeed – has a much easier time delivering high throughputs while still keeping the 99th percentile response time under a certain limit.
Increasing the heap size helps Intel to close the gap somewhat (up to x2), but at the expense of the throughput numbers (-20% to -25%). So it seems that the Intel chip needs more tuning than the ARM one. To investigate this further, we turned to “Transparant Huge Pages” (THP).
Since experience tells us that it is quite rare for one CPU to beat another in a benchmark by a factor 3, we investigated the matter further. The most obvious candidate was Huge Pages, or as everybody besides the Linux community calls it: “Large Pages”.
Every modern CPU caches the virtual-to-physical memory mappings in their TLBs. The “normal” size of a page is 4 KB, so with 1536 entries, the Skylake core can only cache about 6 MB per core. Consequently, as DRAM capacity has grown the past 15 years from a few GB to hundreds of GBs, TLB misses have become more and more of a concern. A TLB miss is quite expensive – costing several memory accesses in total – as you need to read out several tables to finally find the physical address.
All modern CPU support larger pages. In the x86-64 (Intel & AMD) a 2 MB large page is the most popular option, while a 1 GB page is also available. Meanwhile a large page on the ThunderX2 is no less than 0.5 GB. Using large pages reduces the number of TLB misses (although the number of entries in the TLB is typically much lower for large pages), and also they reduce the number of memory accesses needed if a TLB miss occurs.
However, it took a while before Linux supported this feature in an easy to handle way. Memory fragmentation, conflicting and hard to configure settings, incompatibilities, and especially very confusing names caused a lot of trouble. In fact, many software vendors still advise server admins to disable large pages. So while it was quickly embraced for benchmarks, the software community as a whole is still hesitant.
To that end, let’s see what happens if we enable Transparent Huge Pages and keep the best settings we discussed on the previous page.
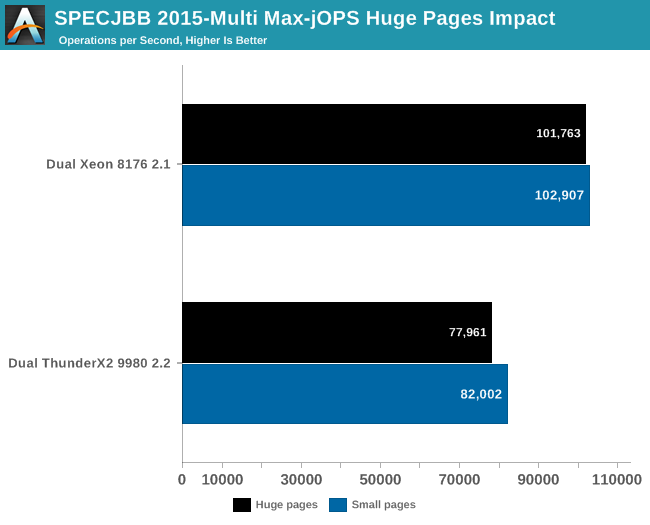
Overall, for Max-jOPs the performance impact is nothing spectaculair; in fact it’s a slight regression. The Xeon loses about 1% of its throughput, the ThunderX2 about 5%.
Moving on, let’s check out the Critical-jOPS metric, where throughput is measured with a 99 percentile response time constraint.
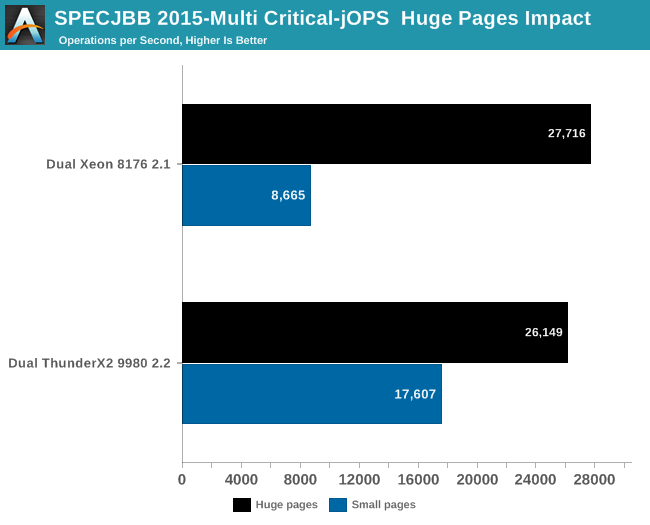
A massive difference! Instead of taking a massive beating, the Intel setup edges out the ThunderX2. Still, it must be said that performance with 4 KB pages seems to be a major weakness with Intel’s architecture.
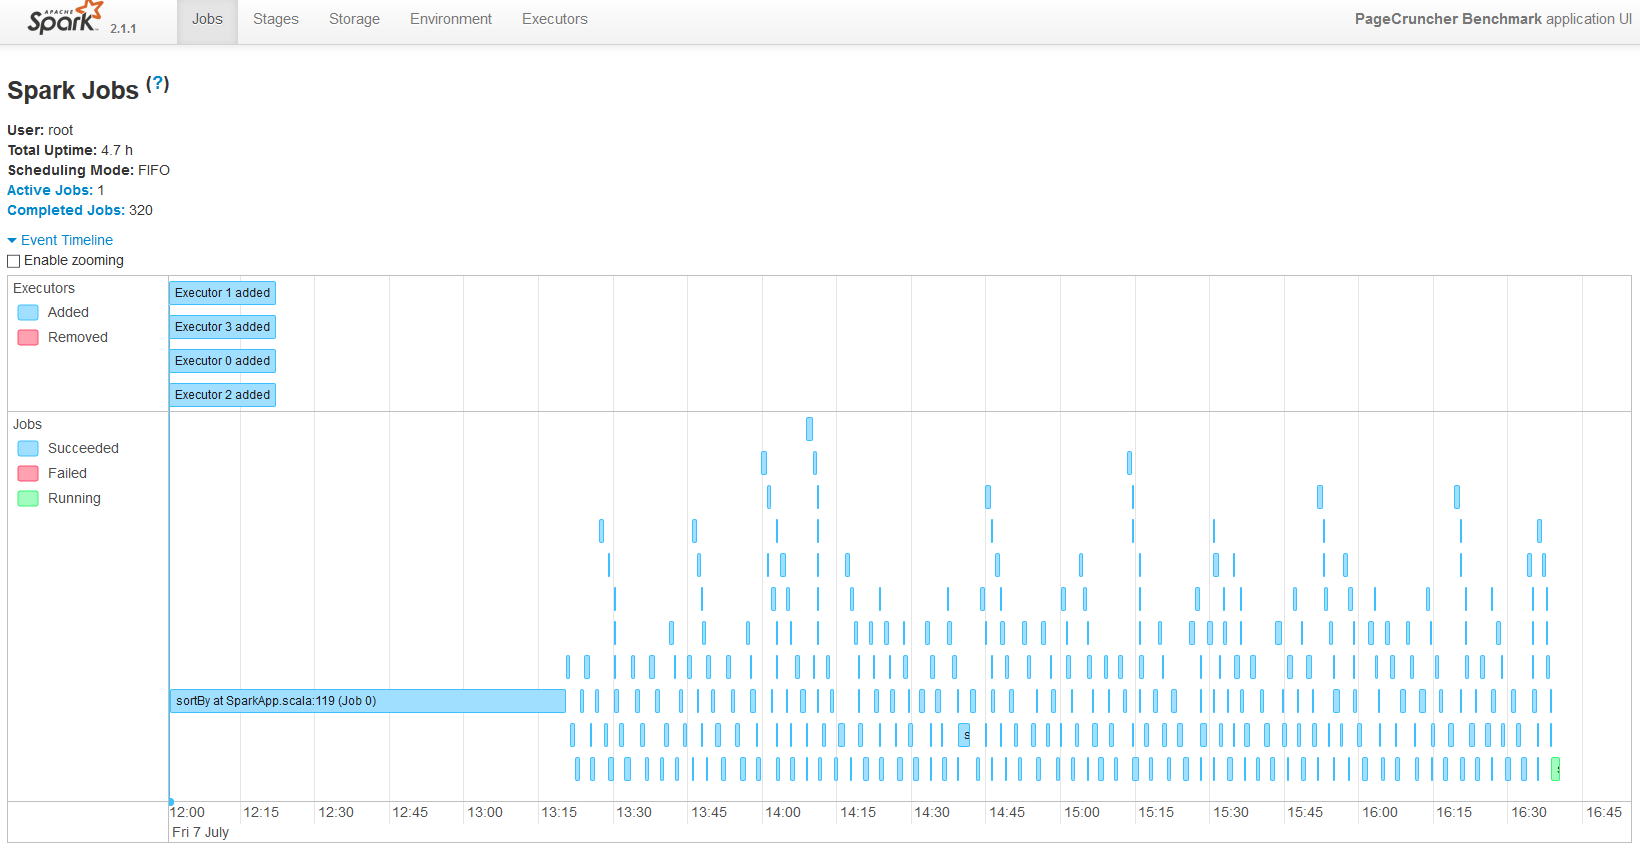
Last, but not least, we have Apache Spark. Apache Spark is the poster child of Big Data processing. Speeding up Big Data applications is the top priority project at the university lab I work for (Sizing Servers Lab of the University College of West-Flanders), so we produced a benchmark that uses many of the Spark features and is based upon real world usage.

The test is described in the graph above. We first start with 300 GB of compressed data gathered from the CommonCrawl. These compressed files are a large amount of web archives. We decompress the data on the fly to avoid a long wait that is mostly storage related. We then extract the meaningful text data out of the archives by using the Java library “BoilerPipe”. Using the Stanford CoreNLP Natural Language Processing Toolkit, we extract entities (“words that mean something”) out of the text, and then count which URLs have the highest occurrence of these entities. The Alternating Least Square algorithm is then used to recommend which URLs are the most interesting for a certain subject.
To get better scaling, we run with 4 executors. Researcher Esli Heyvaert reconfigured the Spark benchmark so it could run on Apache Spark 2.1.1.
Here are the results:
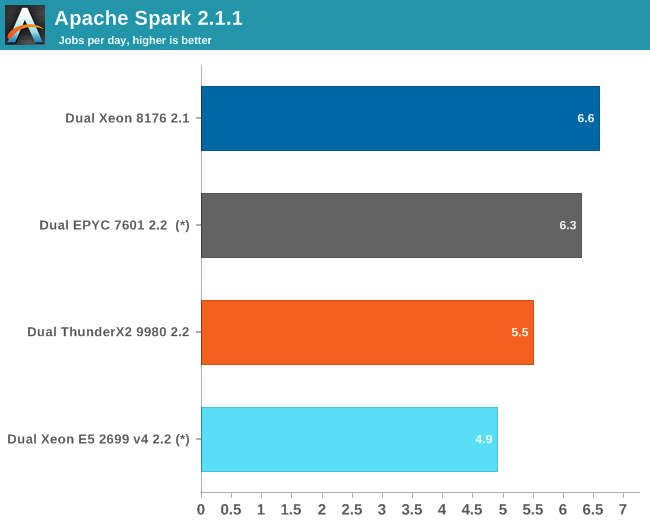
(*) EPYC and Xeon E5 V4 are older results, run on Kernel 4.8 and a slightly older Java 1.8.0_131 instead of 1.8.0_161. Though we expect that the results would be very similar on kernel 4.13 and Java 1.8.0_161, as we did not see much difference on the Skylake Xeon between those two setups.
Data processing is very parallel and extremely CPU intensive, but the shuffle phases require a lot of memory interactions. The time spent on storage I/O is negligible. The ALS phase does not scale well over many threads, but is less than 4% of the total testing time.
The ThunderX2 delivers 87% of the performance of the twice as expensive EPYC 7601. Since this benchmark scales well with the number of cores, we can estimate that the Xeon 6148 will score around 4.8. So while the ThunderX2 can not really threaten the Xeon Platinum 8176, it gives the Gold 6148 and its ilk a run for their money.
Wrapping things up, our SPECInt analyses show that the ThunderX2 cores still has some weaknesses. Our first impression is that branch intensive code – especially in combination with regular L3-cache misses (high DRAM latency) – run quite a bit slower. So there will be corner cases where the ThunderX2 is not the best choice.
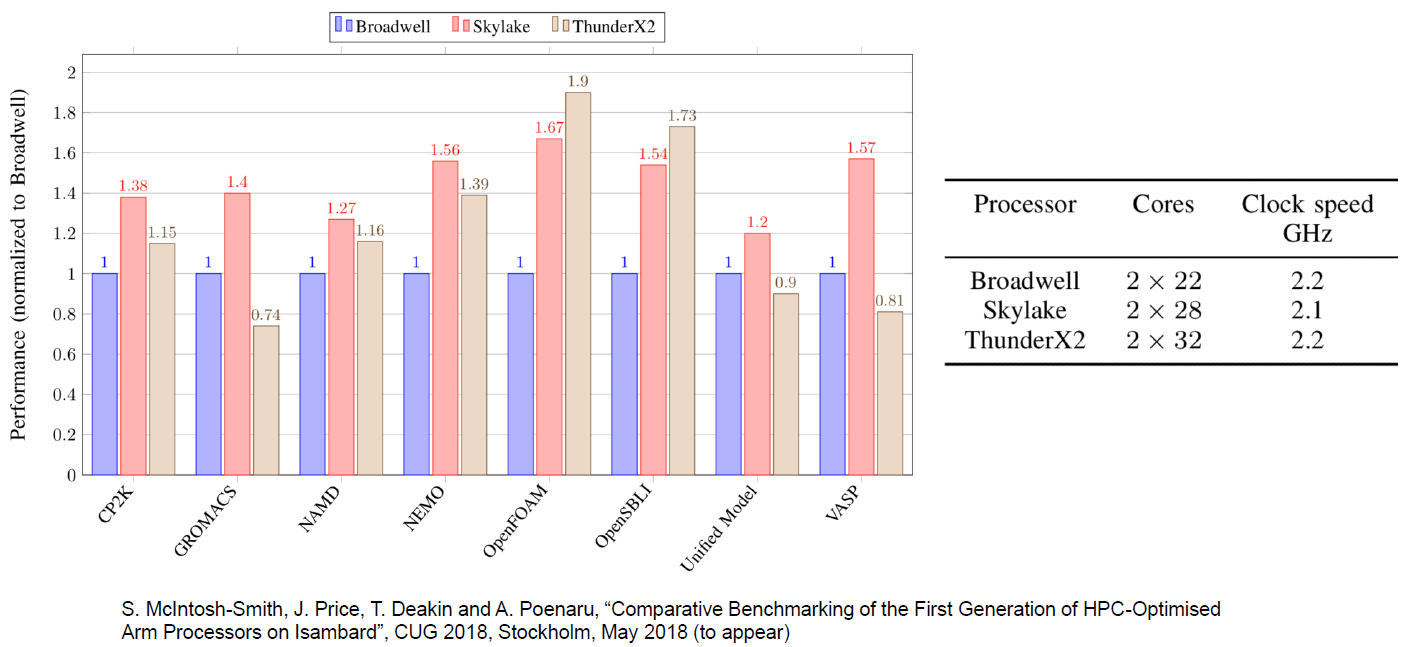
However, other than some niche markets, we are pretty confident that the ThunderX2 will be a solid performer. For example, the performance measurements done by our colleagues at the University of Bristol confirm our suspicion that memory intensive HPC workloads such as OpenFoam (CFD) and NAMD.run really well on the ThunderX2
From the early server software testing we have done so far, we can only be pleasantly surprised. The performance-per-dollar of the ThunderX2 in both Java Server (SPECJbb) and Big Data processing is – right now – by far the best in the server market. We have to retest AMD’s EPYC server CPU and a Gold version of the current generation (Skylake) Xeon to be absolutely sure, but delivering 80-90% of the performance of the 8176 at one fourth of the cost is going to very hard to beat.
As an added benefit to Cavium and the ThunderX2, here in 2018 the Arm Linux ecosystem is now mature; specialized Linux kernels and other tools are no longer necessary. You just install Ubuntu Server, Red Hat, or Suse, and you can automate your deployments and software installation from the standard repositories. That is a massive improvement compared to what we experienced back when the ThunderX was launched. Back in 2016, simply installing from the regular Ubuntu repositories could cause problems.
So all in all, the ThunderX2 is a very potent contender. It might even be more dangerous to AMD’s EPYC than to Intel’s Skylake Xeon thanks to the fact that both Cavium and AMD are competing for much of the same pool of customers considering switching away from Intel. This is because the customers who have invested in expensive enterprise software (Oracle, SAP) are less sensitive to cost on the hardware side, so they are much less likely to change to a new hardware platform. And those people have been investing the past 5 years in Intel as it was the only option.
That in turn means that those who are more agile and cost sensitive, such as hosting and cloud providers, will now be able to choose an Arm server CPU alternative with an excellent performance-per-dollar ratio. And with HP, Cray, Pengiun computing, Gigabyte, Foxconn, and Inventec all offering systems based upon the ThunderX2, there isn’t a shortage of quality vendors.
In short, the ThunderX2 is the first SoC that is able to compete with Intel and AMD in the general purpose server CPU market. And that is a pleasant surprise: at last, an Arm server solution that delivers!