Categorie
Energia

My Technical Career Journey towards becoming an Impact Maker in Supply Chain

Author: Schneider Electric

This audio was created using Microsoft Azure Speech Services

My Career Path in Industrial Automation started as an Intern while pursuing my Engineering master’s in Computer Control and Automation. Curious and ambitious, I stepped into Machine Solutions (Now Digital factory) Singapore R&D lab in 2018. It was such a mixed feeling. From being wonderfully shocked to work with a team of people from diverse backgrounds to being intimidated by their technical expertise. But the latter did not last for long. I could picture how everyone in the team was willing to accept suggestions and take responsibility for their actions. This culture is quite infectious, so I began to do the same. While working closely with the team, I was quickly able to adapt to the work culture, the people, the technology, the food, and the culture. Some of my memorable moments in Schneider include team building activities, Annual “Dance & Dinner” events, and celebrating cultural festivities together as a team, starting from Chinese New Year ‘Lo Hei’ to Diwali to Christmas dinners.

Within three months of my Internship, I was offered a full-time role as a System Verification Engineer. It is an Inquisitive journey as a team to witness the device take shape, starting from working with prototypes, to learning new Industrial Communication protocols, introducing Innovation, integrating the Hardware, software, and firmware, and vigorously testing it. It is astounding to see how the product, like a small piece, fits into a big puzzle, working seamlessly with the complete system and solution that Schneider caters towards Sustainability and Digital Transformation of Industries. I am happy and proud to play this part that contributes to Schneider’s IMPACT values.

Drawing Inspirations and Healthy competitiveness 

Curiosity, constant learning, and experimenting are big driving factors in a technical career path. I have had a massive learning curve, learning every day. This made me agile to any new technological adaptation that the project needed and cultivate the growth mindset. During my 5-year journey in Digital Factory, I am happy to have collaborated with various R&D teams in Germany & France on new projects and recent technology. This also gave me an opportunity to visit France, explore their country’s culture and try skiing and trekking with the team. I was also able to display my work and expertise, which won me responsibilities like PLC Validation projects. I understood that it is necessary to draw Inspiration and learn from various teams. A little healthy competition among sites never hurt anyone. It is okay to experiment and take risks, you only learn more from it!

I love participating in IA Hackathons. It was during one of these Cybersecurity Hackathons that I realized my passion and Interest towards Cybersecurity and started learning a lot more on this topic. I love that Schneider has this environment where everyone can voice their concerns and have open conversations with managers about their career. I expressed my interest and had great opportunities to work on Cybersecurity topics for various products in IA.  

Transition to Industrialization 

I leveraged Schneider’s “Open Talent Market” to connect with mentors and participate in interesting projects. It is eye-opening to learn from experts and senior leaders, their journey, and experiences. I learnt about various business units, their offers and solutions and their sustainability goals. I had the opportunity to hear from a few SVP’s and here are some key takeaways. Always be open to new opportunities, you never know when it might knock on your door. Never be worried about making mistakes, it is not called “failure,” it is a steppingstone to success. Do not be afraid to make bold decisions.

It was during one of these networking sessions that I participated in a campaign on #SheShapesAutomation and met fellow passionate women in Industrial Automation. I learnt more about Industrialization and GSC teams during this interaction. It got me hooked and was approached later for a career move into Industrialization team! That is the culture in Schneider. To Identify talents, provide growth, and explore different domains and business units. I love the confidence, determination and grit of women pursuing technical careers. The best part is that Industrial Automation has such inspiring women leaders starting from the Director to the VP, to the SVP, who are leading by example, making bold decisions, and striving towards excellence.

I accepted the new role and believed that my expertise in Cybersecurity, transferable technical competencies and product knowledge can aid in bridging gaps In Industrialization. I feel empowered and positive with Learning Link and role specific trainings that ensure my smooth transition. As I progress, I am planning to make use of Upskilling Initiatives and be an Electrifier. I am looking forward to working closely with the team and cannot wait to see what the future holds for me and us.  

Turn ambition into action  

Join us in our efforts to bridge progress and sustainability for all through automation, electrification, and digitalization. Become an impact maker at Schneider Electric!

Check out our careers website for more information and for open positions.

About the author

Author ProfileAuthor Profile

Neetha Rajasekaran, Senior Product Test Engineer

Neetha is a Senior Product Test Engineer from Industrialisation Team, based out of Singapore. She holds a Engineering Master’s in Computer Control and Automation. Her Schneider Career journey started as an Intern in 2018 in the Digital Factory team. She has experience working on various Industrial Automation products and is passionate about Cybersecurity. Her aspirations include contributing towards Industrial Digital Transformation and building a sustainable future.

Tags: impact makers, intern, Supply chain, technical career

Categorie
Energia

Will reducing your energy use at home actually help reduce global warming?

Author: Schneider Electric

This audio was created using Microsoft Azure Speech Services

Global warming is one of the most, if not the most, pressing issue facing our world today. With the magnitude of the situation dominating the global agenda, many of us are looking to large businesses (68%) and national governments (62%) to instigate change, according to our latest global consumer survey.

While these bodies play a crucial role, the impact of the individual should not be underestimated when it comes to contributing to a healthier planet. Collective action can yield powerful results, and this was recognised in the response to our survey, in which individuals ranked third at 52%.

This is evident when noting that it takes a great deal of energy to run our homes. According to the United Nations, the energy supply sector accounts for 35% of global emissions, making it the largest contributor to greenhouse gas emissions. Highlighting this can help us to understand how big an impact each individual can have when observed collectively.

And while many of us are aware of the impact our households have on climate change and global warming, with more than half of the population realising the importance of their homes becoming net zero within their lifetime, 40% feel like this is unlikely to happen.

Will reducing your energy use at home actually help reduce global warming?Will reducing your energy use at home actually help reduce global warming?

The links between energy use & sustainability

Today, many of us see sustainability and energy use as being intrinsically linked and having a direct impact on each other. For example, increasing energy bills was the number one concern for people (86%), should global temperatures rise by more than 1.5ºC.

But could this work in reverse? If we reduce our energy consumption, will this help to lower global temperatures?

You’ll be glad to hear that the answer is yes!

The biggest home contributors of home energy use

Let’s look at what represent 60 to 70% of our energy use – home heating.

In the UK, this accounts for around 37% of the country’s total carbon emissions because many homes still rely on gas boilers.

To break this down further, carbon emissions from heating are as follows…

  • Space heating – 17%, with as much as 14% being attributed to domestic homes
  • Hot water – 4%
  • Cooking – 2%

These carbon emissions are greenhouse gasses, which are heating the planet. By reducing our reliance on fossil fuels such as gas and switching to renewable energy, we can begin to make a real dent in minimising the impact of global warming. That is why many countries around the world currently have Net Zero targets and deadlines in place, and are offering financial incentives to homeowners in return for replacing their gas boilers with renewables such as heat pumps and solar.

Whilst take-up in renewables does vary around the world – largely driven by the suitability of existing homes and the cost – there are still things we can be doing to reduce our carbon emissions as much as possible at home, even with a gas boiler.

How to reduce carbon emissions at home today

1. Get smarter with your heating

 Get smarter with your heating Get smarter with your heating

Technology is already playing a significant role in how we consume and manage our energy, and can support reducing carbon emissions. A smart heating control, such as Wiser, can be used to help optimise the performance of your heating system through features such as optimum stop and weather compensation. In doing so, the boiler doesn’t need to work as hard or run for as long, to deliver the desired levels of heat. The less time a gas boiler is fired, fewer carbon emissions are released. Another way to reduce carbon emissions from your heating is to lower the flow temperature of the system.

2. Upgrade inefficient appliances

Upgrade inefficient appliancesUpgrade inefficient appliances

With older, inefficient appliances, you may be producing more carbon emissions than you realise. A good first step is to monitor your energy use to identify any appliances consuming a lot of energy.

When you know the main culprits, you can look at whether you can change their run settings to some form of Eco mode, or if they need replacing altogether.

3. Improving building materials

reducing your energy use at home actually help reduce global warmingreducing your energy use at home actually help reduce global warming

Insulating homes efficiently is another great way to reduce overall energy consumption. For example, houses with effective loft insulation and high-performance windows and doors can retain more heat, meaning that the reliance on heating the home becomes less, in turn releasing fewer carbon emissions.

4. Encourage open conversation and behaviour change

reducing your energy use at home actually help reduce global warmingreducing your energy use at home actually help reduce global warming

While reducing global warming may feel like an overwhelming feat, it is clear that there is a lot that can be done when it comes to reducing the home’s carbon emissions.

As they say, knowledge is power, and having regular conversations with one another about what changes can be made within the home is key to driving down our personal carbon footprints.

While the statistics surrounding energy consumption make for sobering reading, it also empowers us to understand what more we can do to help reduce carbon emissions and create change that will promote a happier and healthier planet. Luckily, as technology develops and education on the environment becomes clearer, we can begin to make changes at household level that will impact the future of the world.

To learn more about the results of our 2023 global consumer survey, read the report here.

Tags: Digital transformation, Energy Efficiency, energy management, reduce energy consumption, Sustainability

Categorie
Energia

Concentrazioni di radon ed efficientamento: come evitare i pericoli

Author: Rinnovabili.it

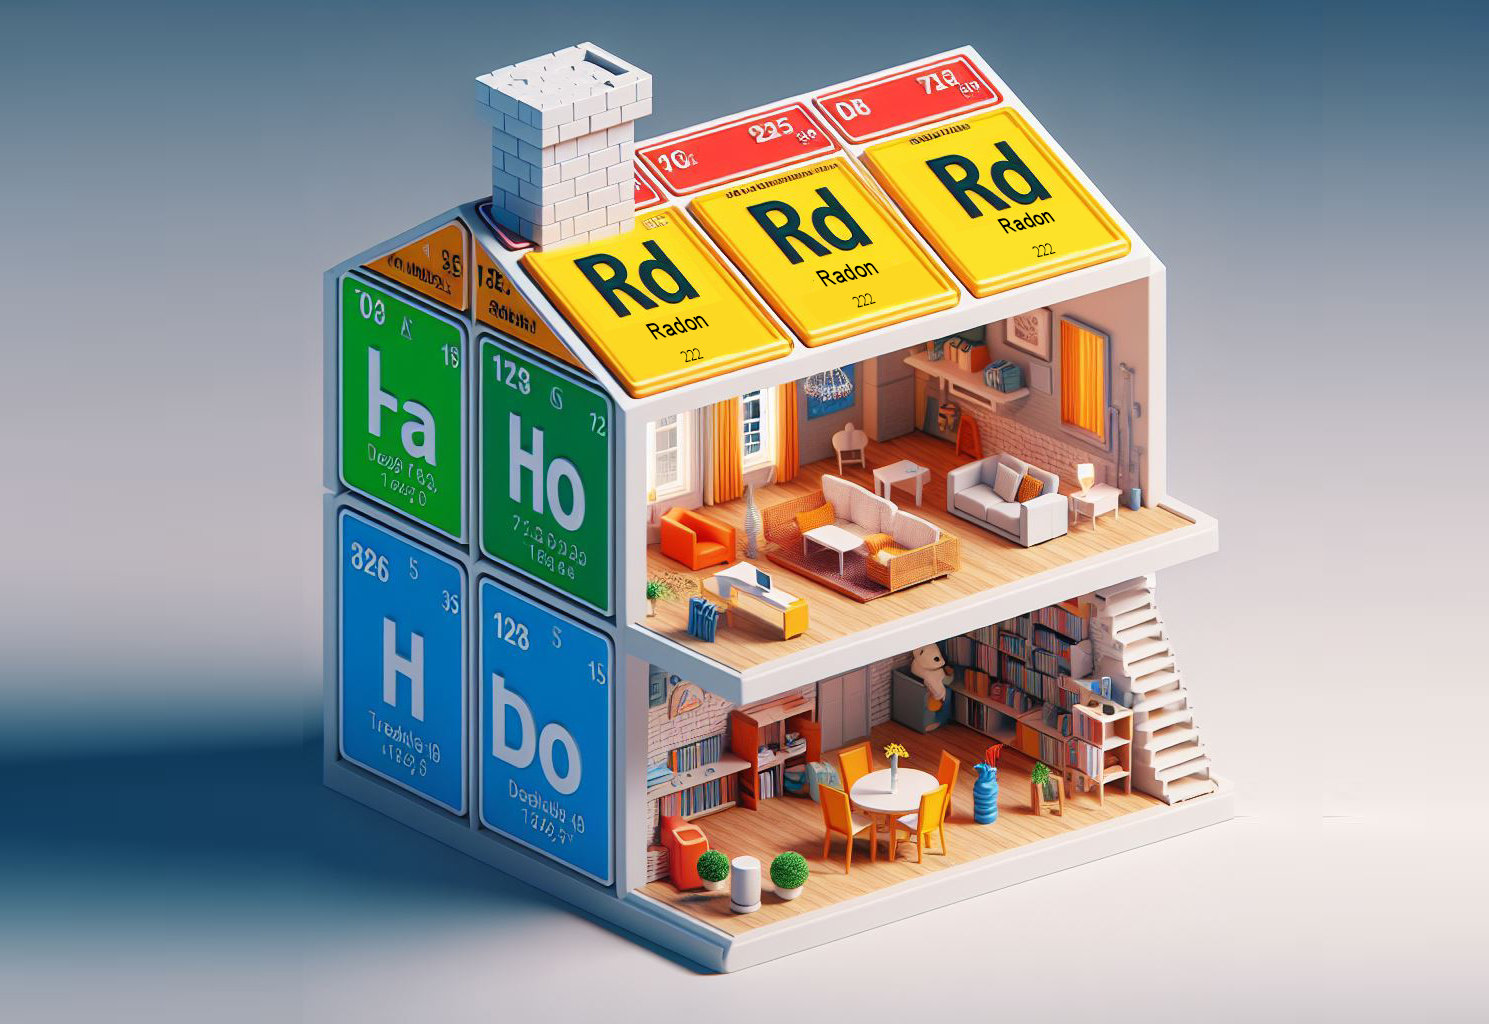
Concentrazioni di radonImagine creata con IA

Secondo le stime disponibili, sarebbero circa 800.000 le abitazioni in Italia con concentrazioni di radon superiori ai 200 Bq/m3

(Rinnovabili.it) – C’è un nemico invisibile nelle nostre case e nei nostri uffici, un nemico inodore, incolore e insapore, estremamente pericoloso per la salute umana. E’ il radon, un gas nobile radioattivo naturale presente nel suolo, nelle acque e nei materiali da costruzione, classificato dall’Organizzazione Mondiale della Sanità nel Gruppo 1 delle sostanze cancerogene. Se diluito in aria all’aperto è innocuo, ma negli ambienti indoor, se non correttamente aerati, le concentrazioni di radon possono anche superare i livelli di rischio.

Purtroppo, come dimostrato da molteplici studi, gli interventi di efficientamento e risparmio energetico degli immobili se non correttamente abbinati ad un sistema di aerazione controllata, possono produrre edifici “ermetici” facilmente soggetti alla presenza di radon.

Il Piano di nazionale d’azione per il radon 2023-2032

A livello normativo il principale riferimento per la corretta valutazione dei rischi nelle concentrazioni di radon è il dlgs 101/2020. Questo decreto prevede la stesura di un Piano Nazionale d’azione per il radon (PNAR) da aggiornare ogni 10 anni. Proprio nelle scorse settimane il ministero della Salute ha pubblicato in GU il nuovo PNAR 2023-2032, mettendo nero su bianco le linee d’azione necessarie per ridurre l’esposizione della popolazione al radon. 

Monitorare le concentrazioni di radon anche negli interventi di efficientametno

Il Piano agisce su tre macro aree declinate in azioni, a loro volta articolate in attività. 

Al loro interno devono trovare posto anche le problematiche di associazione della protezione dal radon ai corrispondenti programmi di intervento, inclusi quelli sulla prevenzione del fumo, sul risparmio energetico e sulla qualità dell’aria negli ambienti chiusi. I numerosi incentivi legati all’efficientamento degli edifici messi in atto negli ultimi anni, hanno dato una grande spinta agli interventi di riqualificazione. Attenzione però: come è dimostrato da numerosi studi, tali interventi possono produrre un aumento della concentrazione di radon indoor specialmente se realizzati con modalità che non tengono conto del loro impatto sulla concentrazione di radon e se non vengono contemporaneamente abbinati interventi di risanamento da radon. 

Gli interventi riguardanti l’efficientamento energetico degli edifici devono quindi tenere conto del radon affinché nell’ambito del medesimo intervento edilizio si abbia un risanamento dal punto di vista sia energetico sia del radon”, sottolinea il PNAR ribadendo che “Va assolutamente evitato che un intervento di risparmio energetico causi un peggioramento della esposizione al radon”. 

Gli obiettivi del Piano nazionale d’azione per il radon al 2032

Sulla base dei dati disponibili raccolti dalle prime rilevazioni degli anni ’80 si stima che le abitazioni in Italia con una concentrazione di radon superiore ai 200 Bq/m3 siano il 4%, circa 800.000 abitazioni. 

Quelle con concentrazioni di radon superiori a 400 Bq/m3 siano l’1% e cioè circa 200.000, mentre la stima per i luoghi di lavoro che superano i 300 Bq/m3 è pari a circa 200.000.

Gli obiettivi specifici di riduzione dell’esposizione al radon da realizzarsi nei prossimi 10 anni del Piano sono: 

  • la riduzione delle concentrazioni di radon nei luoghi di lavoro con concentrazione di radon superiore ai 300 Bq/m3, nel rispetto delle previsioni normative;
  • la riduzione della concentrazione di radon almeno nel 50% delle abitazioni, ricadenti nelle aree prioritarie nelle quali sia stata riscontrata una concentrazione di radon superiore ai 200 Bq/m3, dando priorità a quelle con concentrazione superiore a 300 Bq/m3;
  • la riduzione della concentrazione di radon almeno nel 50% delle abitazioni del patrimonio di edilizia residenziale pubblica, ricadenti nelle aree prioritarie, con concentrazione di radon superiore ai 200 Bq/m3, dando priorità a quelle con concentrazione superiore a 300 Bq/m3;
  • la verifica che il livello di concentrazioni di radon sia inferiore ai 200 Bq/m3 nelle nuove costruzioni realizzate dopo il 31 dicembre 2024. 
Categorie
Energia

Scope out your Emissions: A Simple Tool to Assess your Building’s Electricity Impact

Author: Schneider Electric

This audio was created using Microsoft Azure Speech Services

We need power to keep the lights on – to keep our businesses and our lives humming. We also know where that power comes from greatly impacts the environment. What we haven’t had is a simple, direct, and visible way to understand and quantify how our energy consumption impacts emissions and an easy means to evaluate progress over time. We’re changing that today with the launch of our free-to-use web-based TradeOff Tool called the “Site Electricity Emission Factor Calculator”.  For every kWh of electricity your site consumes, the intensity of the carbon emissions emitted (also referred to as an electricity emission factor) can span anywhere from 0 g CO2e/kWh (really good!) to over 1,000 g CO2e/kWh (really bad!).

As sustainability and net-zero rise to the forefront of many conversations, and our changing environment becomes a growing concern, it’s important you:

  1. Understand how your electricity consumption impacts your emissions, in other words, quantify it.
  2. Set goals to reduce it.
  3. Evaluate progress over time.

Estimating the emissions factor

Our new, simple-to-use Site Electricity Emission Factor Calculator helps users estimate the emission factor (kg/MWh, kg/kWh, or g/kWh). The site could be a data center, a commercial office building, a hospital, a residential building, or any building that consumes electricity.

If we assume the building’s electrical efficiency is the best it can be, then the only other way to further reduce electricity generation emissions and their impact on the environment is to reduce the carbon-intensity of that electricity. The figure below shows the emission factor for 8 common sources of electricity, ranked from best to worst. These rankings can serve as a benchmark to understand the range of possibilities and to see their relative climate impact. In practice, nearly every site will have some mix of these electricity sources, including those from:

  • Utility-provided electricity
  • Onsite-generated electricity
  • Renewable contracts

Figure: Benchmark of Emission Factors by Electricity Source (g CO2e/kWh)

A screenshot of a computer  Description automatically generated

Location, location, location

According to Our World in Data, in 2022, the global average emission factor was 438 g CO2e/kWh and the U.S. average was 368 g CO2e/kWh. But the values span widely from country to country and state to state because the source mix varies so much. In addition, the average mix will continue to evolve year over year, as utilities work to add more renewables like solar, wind, and hydro-power, and take high-carbon-emitting fossil fuels like coal offline. Utility providers generally publish their source mix on their website if you want more localized data, but our tool gives you a starting point for the location you select, based on data from Our World in Data and Nuclear Energy Institute (NEI).

Onsite generation

Buildings may choose to supplement their utility-provided electricity with onsite generation for several reasons. It may be for cost-savings (i.e., avoiding expensive time-of-use pricing), reliability/resiliency improvement (i.e., provide backup power in case of grid outages), and/or environmental benefits (i.e., reduce the carbon footprint). The type(s) of onsite generation and the hours used directly impact your overall emission factor. A diesel generator emits 973 g/kWh vs. a natural gas generator, which has a cleaner burning process, emits 719 g/kWh; whereas generating electricity with onsite renewables like solar or wind emit zero.

Renewable contracts to offset emissions

The third part of the electricity mix that is becoming more common due to increased demand for clean energy is the use of renewable contracts. S&P Global Commodity Insights: states, “US renewable energy credit market size to double to $26 billion by 2030”. Renewable contracts allow you to reduce your emissions by contracting with a renewable energy provider and supporting the generation of clean electricity. Some contracts come with renewable energy certificates (RECs), which represent the environmental benefit of 1 MWh of renewable electricity generation. These can be used to claim the associated emissions reductions.

Understanding the breakdown of your electricity emission factor

Our new simple-to-use, web-based tool (shown in the Figure below) helps you not only see your overall electricity emission factor, but helps you understand the breakdown of where the emissions come from. You may have heard the terms Scope 1, Scope 2, and Scope 3 GHG emissions. Well, if you have some combination of utility-provided and onsite generated electricity, your electricity leads to emissions in all three of these categories (with the exception of renewables).

Scope 1 emissions are all direct emissions within the operational control of the data center. In the case of electricity, this comes from operating generators onsite.

Scope 2 emissions are all indirect emissions generated from purchased or acquired electricity, heat, steam, or cooling (i.e., energy). In the case of electricity, this is the acquired electricity from a provider.

Scope 3 emissions are all other indirect emissions from sources such as business travel, waste management, manufacture of the products you buy across the value chain. This category is often not considered or broken out when quantifying electricity-related emissions. The electricity-based portion of Scope 3 emissions comes from the pre-combustion process as well as the transmission and distribution of the electricity to the site. For instance, for coal-generated electricity, Scope 2 accounts for 962 g/kWh and Scope 3 is 103 g/kWh, which sums to the total value of 1,065 g/kWh in the earlier figure. White Paper 99, Quantifying Data Center Scope 3 GHG Emissions to Prioritize Reduction Efforts, dives deeper into Scope 3 and demonstrates how to identify the largest emission sources in data centers.

Site Electricity Emissions Factor Calculator

The tool lets you play around with “what-if” scenarios to see how your emission factor would change as you change your mix of utility, onsite, and renewable contracts. It provides graphs that illustrate the overall electricity emission factor, and lets you see which sources are contributing to your overall emission factor, then drill into the specific scopes.

Give the tool a try. I believe it will enlighten you to the make-up of your electricity emission factor, what the drivers are, and what actions you can take to reduce it. Tell us what you think!

Tags: #sustainability, data center, DC Professional, electricity, Electricity 4.0, Emissions

Categorie
Energia

Revolutionizing Germany’s energy landscape: The Wilhelmshaven floating LNG terminal

Author: Schneider Electric

This audio was created using Microsoft Azure Speech Services

At the start of Europe’s current energy crisis, Germany sought an alternative solution. The government would work with Wilhelmshaven to build a floating liquefied natural gas (LNG) shipping terminal— the nation’s first such facility. The terminal project, also known as a floating storage regasification unit (FSRU), was built at a breakneck pace. It accepted its first shipment less than nine months later.

“When we work together, we can do things at great speed,” said German Chancellor Olaf Scholz, during the FSRU’s opening ceremony. “That’s Germany’s new tempo.”

Uniper Energy collaborated with Schneider Electric to enable high performance in its floating LNG terminal.Uniper Energy collaborated with Schneider Electric to enable high performance in its floating LNG terminal.

This terminal is a key component in the country’s quest to diversify its gas supplier base and lay the groundwork for some of its future sustainable energy initiatives. The project demonstrates how collaboration between governments and industry partners can deliver innovative solutions to support energy independence.

Natural gas supply under stress

Natural gas comprised 27% of Germany’s energy mix, with more than half sourced from Russian pipelines. Growing geopolitical tensions steadily reduced supplies. This meant conservation measures were unlikely to fill the gap and prevent rationing. Subsequently, gas prices quadrupled, imperiling industrial production, electricity generation, and private household heating.

Germany needed access to additional gas sources quickly. An FSRU was the answer. It offered much lower costs for construction and faster completion times. This ability to import and offload LNG from dependable nations through FSRUs was an opportunity to rapidly diversify their energy needs.

If necessary, an FSRU can be relocated or repurposed into an LNG carrier. Approvals were swiftly granted and the location chosen. It became essential for the government and the supplier industry to examine how to transform old collaboration models. Doing so helped achieve aggressive construction deadlines.

Industrial automation, a key enabler for high-performance LNG facilities

With the support of the Federal Government of Germany, Wilhelmshaven was selected due to being Germany’s only deep-water port capable of allowing large tankers to dock and transship independently of tidal conditions. The terminal facility, owned by international power provider and leading European gas supplier Uniper Energy, includes berthing facilities and a high-pressure loading platform for LNG tanker docking.

The FSRU consists of storage tanks and regasification machinery connected to an onshore transshipment jetty. (This is linked to Germany’s long-distance gas transmission network via 26 kilometers of new pipeline).

The LNG regasification process at the terminal is complex, requiring several pumps, compressors, chillers, and motor starters. An intricate network of pipes and valves further helps ensure the supercooled liquid is efficiently and precisely converted back to a gaseous form.

With the inherent risks associated with processing volatile petrochemicals, the Wilhelmshaven terminal (and the energies and chemicals industry in general) required industrial automation and process safety technology to monitor, coordinate, and optimize production processes with extraordinary precision to help ensure:

  • Peak operational performance and profitability
  • Personnel safety
  • Environmental regulation compliance

Uniper Energy collaborated with Schneider Electric to enable high performance in its floating LNG terminal.Uniper Energy collaborated with Schneider Electric to enable high performance in its floating LNG terminal.

Continuous monitoring, management, and optimization of the high-value assets used in Energies and Chemicals production processes require a state-of-the-art distributed control system (DCS) and safety instrumented system. For the Wilhelmshaven terminal project, Uniper chose:

The Triconex SIS offers flexibility and adaptability to scale as needed. Such versatile architectures can help save on installation costs and engineering time. Triconex is also compliant with the IEC 62443 cybersecurity standard, enabling robust safety and high levels of integrity and resilience.

Collaboration addresses four key implementation challenges

Once the Wilhelmshaven terminal build decision was made, it was “all hands on deck” for every stakeholder. Close collaboration between government, suppliers, and construction teams helped keep the project on schedule. Commitments were made to explore co-innovations to uniquely resolve potential delays and difficulties, including:

  1. Compressed project timelinesProject management, engineering, and installation teams leveraged extensive system design and strategic planning experience to streamline system installation. Schneider and Uniper exceeded the project’s aggressive 10-month completion schedule. Engineering optimized DCS and SIS solutions and developing a logistical implementation plan helped overcome supply chain constraints and accelerate system testing, commissioning, and training.
  2. Harsh environmental conditions – Energies and chemicals applications, particularly marine environments, present unique challenges for electronic systems (e.g., humidity and salty air). The terminal’s temperature, vibration, particulate, humidity, and corrosive conditions were modeled into system design parameters. This helps ensure the DCS and SIS modules and components were robust and able to perform per specifications. With just one hour of lost LNG production costing as much as $1,250,000, maintaining operations and ensuring quick, safe equipment restarts was crucial.
  3. Third-party equipment and system integration – With multiple vendors providing equipment, it was essential for the DCS to seamlessly integrate data from sensors, smart devices, and subsystems provided by external suppliers. The EcoStruxure ecosystem also utilizes an open, standardized, flexible, object‑based architecture that enables plug‑and‑play interoperability and straightforward third-party equipment integration.
  4. Cybersecurity – With the increasing use of digital technologies to better manage operations and distribution networks, cyberattack threats present a greater risk to critical infrastructure than ever. Cybersecurity, regulatory compliance, and remote network access for Wilhelmshaven were all enhanced. The terminal’s unique network security needs were achieved through robust system hardening, firewalls, expert consultation, and a demilitarized zone (DMZ ) perimeter network. Implementing network-attached storage and integrating Claroty SRA met the terminal’s unique network security needs.

A greener future for Wilhelmshaven 

Since its commissioning on December 21, 2022:

  • The terminal has been running safely, efficiently, and virtually nonstop
  • 42 LNG carriers have delivered around seven million cubic meters of LNG
  • 6% of Germany’s total gas consumption was supplied by the terminal in 2023

With the floating LNG terminal in full operation, Uniper is already planning energy transformation hubs. Such hubs can diversify energy imports and examine how the Wilhelmshaven site (and its surrounding region) can further contribute to a climate-neutral energy supply. In turn, this will help generate green gases and renewable energies, with:

  • A large-scale electrolysis plant on the former Wilhemshaven power plant site
  • An ammonia import terminal near the current LNG facility
  • Solar and wind power plants

The future of Green Wilhelmshaven looks bright. 

Learn how Triconex and Foxboro DCS can help your process control, process safety, and industrial automation challenges.

About the author

Author ProfileAuthor Profile

Frank Ogrissek, Senior Business Development Manager

Frank Ogrissek is the Senior Business Development Manager of Process Automation at Schneider Electric. He graduated from RWTH Aachen University in 1988, and has been working with Schneider Electric since 1997.

Tags: EcoStruxure, Triconex Safety Systems